Download
1 / 10
120 likes | 407 Vues
Electron Distributions Into Shells for the First Three Periods. Lewis Dot Diagrams of Selected Elements. Lewis Diagrams for Compound Formation

E N D
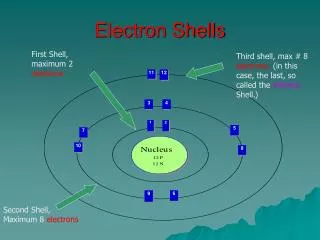
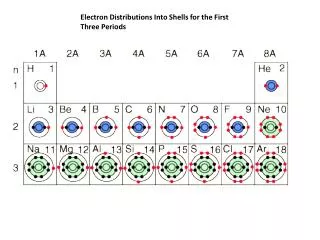
Electron Distributions Into Shells for the First Three Periods
Lewis Diagrams for Compound Formation The formation of many common compounds can be visualized with the use of Lewis symbols and Lewis diagrams. In a Lewis symbol, the inner closed shells of electrons can be considered as included in chemical symbol for the element, and the outer shell or valence electrons are represented by dots. The dots are placed in four groups of one or two electrons each, with 8 electrons representing a closed shell or noble gas configuration. Lewis diagrams are useful for visualizing both ionic and covalent bonds.
In the idealized ionic bond, one atom gives up an electron to the other, forming positive and negative ions.
In the idealized covalent bond, two atoms share a pair of electrons, closing the shell for each of them.
Lewis Diagrams for Multiple BondsLewis symbols and Lewis diagrams can be used to describe multiple bonds, but further information must be supplied to account for the three dimensional geometry of the resulting molecules.
For multiple single bonds, the procedure is similar that for a single bond.
The Lewis diagrams can also help visualize double and triple bonds.
Ionic Compounds Crystalline solids (made of ions) High melting and boiling points Conduct electricity when melted Many soluble in water but not in nonpolar liquid Covalent Compounds Gases, liquids, or solids (made of molecules) Low melting and boiling points Poor electrical conductors in all phases Many soluble in nonpolar liquids but not in water
You can anticipate some things about bonds from the positions of the constituents in the periodic table. Elements from opposite ends of the periodic table will generally form ionic bonds. They will have large differences in electronegativity and will usually form positive and negative ions. The elements with the largest electronegativities are in the upper right of the periodic table, and the elements with the smallest electronegativities are on the bottom left. If these extremes are combined, such as in RbF, the dissociation energy is large. As can be seen from the illustration below, hydrogen is the exception to that rule, forming covalent bonds. Elements which are close together in electronegativity tend to form covalent bonds and can exist as stable free molecules. Carbon dioxide is a common example.