Download
1 / 7
70 likes | 201 Vues
Discover how Edmunds utilizes advanced reporting tools to analyze vehicle shopping activity throughout the Purchase Funnel. Key metrics such as Consideration, Purchase Intent, and New Car Inventory highlight consumer interest and purchasing trends. Our Win-Loss Reports and Brand/Model performance evaluations provide vital insights into competitive positioning and shopper behavior. With this data, automotive brands can effectively tailor their marketing strategies and enhance consumer engagement. Stay ahead with our comprehensive suite of metrics and reports.

E N D
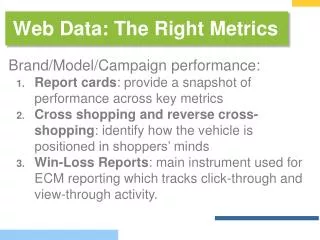
Web Data: The Right Metrics • Brand/Model/Campaign performance: • Report cards: provide a snapshot of performance across key metrics • Cross shopping and reverse cross-shopping: identify how the vehicle is positioned in shoppers’ minds • Win-Loss Reports: main instrument used for ECM reporting which tracks click-through and view-through activity.
Web Data: The Right Metrics • Edmunds has built a suite of reports that will monitor shopping activity through the Purchase Funnel: • Consideration. This metric provides information on how many shoppers are researching specific vehicles. It is used to measure general interest and the impact of offline and online ad campaigns.
CONSIDERATION Optima is ranked 8th in the segment in consideration. Accord has held the first place spot for the past 13 months.
PURCHASE INTENT Purchase Intent measures lower-funnel activities (e.g. configurations, inventory views, and leads) providing a view into what buyers are looking to purchase within the next 15-90 days.This metric is most correlated to sales.
NEW CAR INVENTORY The NCI metric measures serious shoppers willing to go beyond configuring a vehicle and start looking for models near them.
Cross- Shop & TMV Optima TMV in February was just over $26,000—which was $1,000 more than the average TMV of the other vehicles cross-shopped by Optima shoppers. The number one vehicle cross-shopped by Optima shoppers is Accord, which is about ~ $2,000 less.
Win-Loss Chart Shows the weekly share of visitors from an Edmunds page to Tundra VDPs. For example, of F-150’s 10,439 weekly visitors, 4.1% went to a Tundra page the week ending 1/5/14.