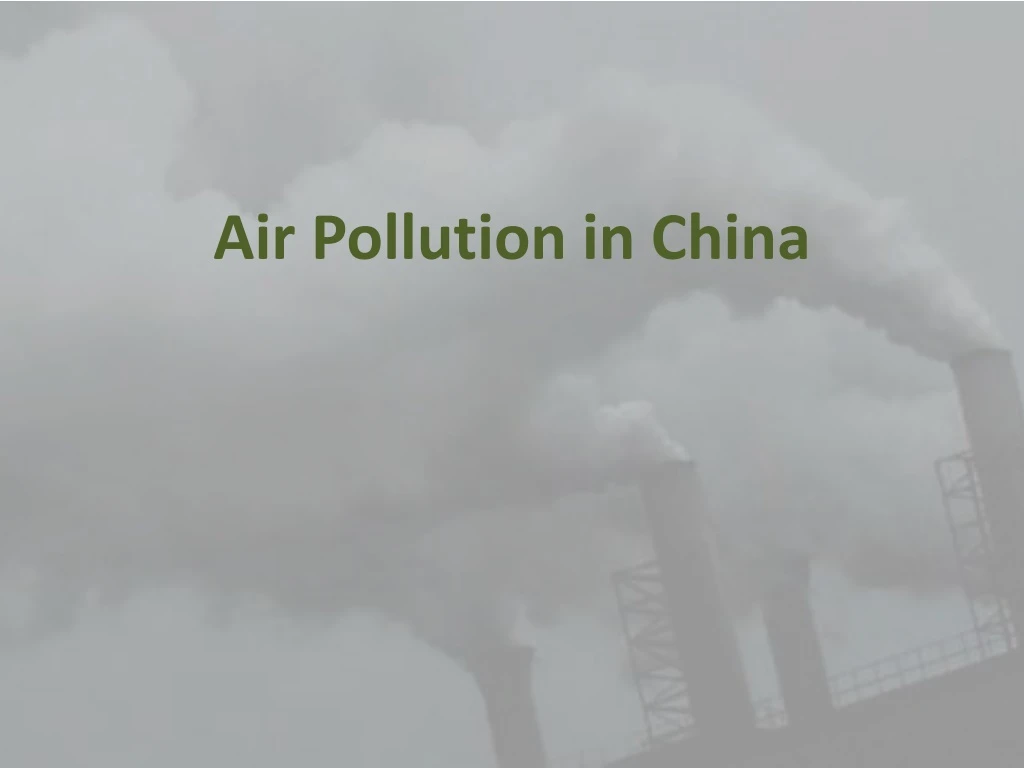
Air Pollution in China
160 likes | 197 Vues
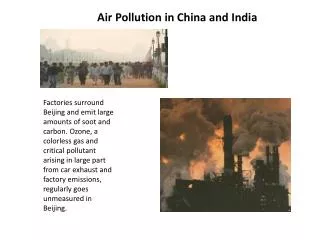
China's air pollution crisis is characterized by high Aerosol Optical Thickness (AOT) and Carbon Monoxide (CO) levels due to reliance on unclean energy sources like coal. This thesis statement explores the impact of aerosols on air quality and health, especially in industrial regions like northeast China and the Shaanxi province. Factors contributing to elevated pollution levels include coal combustion, car emissions, and inefficient energy technology. Strategies to combat pollution, such as alternate-day car usage and relocating polluting factories, have been implemented. However, challenges persist, with adverse health effects like asthma and lung cancer being linked to high AOT levels. The study also highlights the seasonal variations in AOT and CO levels, with Spring showing the highest AOT due to increased coal burning for heating. The text further discusses the impact of pollution on plant growth, climate, and China's efforts to improve air quality, as seen during the Beijing Olympics.

Air Pollution in China
E N D
Presentation Transcript
Thesis Statement High Aerosol Optical Thickness and CO levels in China reveal unsafe levels of pollution in the nation’s atmosphere, mainly due to reliance on unclean energy like coal and outdated, inefficient energy technology in cities and factories.
What is Aerosol Optical Thickness (AOT)? • A measure of how much light airborne particles prevent from passing through the atmosphere • Is increased when aerosols absorb and scatter sunlight • Optical thickness < 0.1: clear sky; Sun is clearly visible • Optical thickness = 1: Sun is difficult to see • AOT helps monitor air quality and the health of an area of land
What’s the relationship between Carbon Monoxide and Aerosol Optical Thickness? • Note that the levels of AOT and CO are higher in the north due to the population concentration in that area. • China constantly emits tons of carbon emissions and has high AOT levels. In 2009, emission levels rose to 1.86 million tons of carbon (A 9% increase). • Burning fossil fuels leads to production of CO. • One of the direct causes of the high AOT is the quantity of air particles emitted as byproducts, which include carbon monoxide. • Chinese major industries include steel production and car production. Many older steel plants are fueled by coal. • China is the world’s second largest consumer of energy. • Its primary fuel is coal, which is mostly burned in inefficient power plants. • These plants belch out large amounts of carbon emissions and sulfur dioxide. • The automobiles in China also emit more carbon emissions than cars found outside. • The total number of privately owned vehicles in China rose by 24.5% (24.38 million cars) from 2007-2008. Private-owned cars numbered 19.47 million. • Some of the worst zones are the mega-cities of Beijing, Shanghai and Guangzhou, as well as the economically developed regions of the Pearl River Delta and Yangtze delta.
During what part of the year are AOT levels in China the highest? The lowest? Scale March 2010 November 2010 Aerosol Optical Thickness is usually the greatest in Spring, while lowest in Autumn. The reason is that during the Winter months, more burning of coal (the primary source of energy in China) occurs for heating. This leaves tons of aerosol in the atmosphere that blocks solar radiation after the Winter heating, while the aerosol drops back down in Autumn since no heating is necessary in the Summer.
During what part of the year are CO levels in China the highest? The lowest? Scale March 2010 November 2010 March 2010 November 2010 Carbon monoxide level follows a similar pattern as aerosol optical thickness.
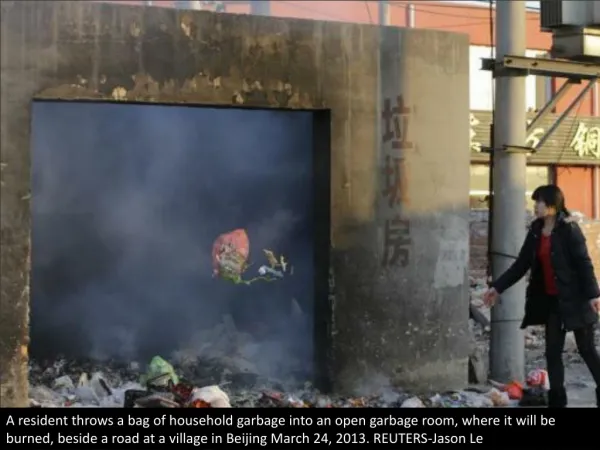
What are China’s most polluted areas? And why? Industrial cities in northeast China and the Shaanxi province experience the most pollution. This trend is due to an uneven distribution of natural resources, overuse of automobiles, inefficient use of resources, and insufficient government regulation over industries. Citizens in cities like Shanghai, Tianying, and Linfen have exploited their coal resources. The CO2 emissions from coal combustion and cars, and the dust from coal mining continue to contribute to China’s air pollution. Shaanxi
How do different AOT levels affect one's quality of life in China? • High AOT products show large amounts of particles within the air • China has high concentrations of particles arising from pollution as well as natural dust blowing in from surrounding deserts, three times that of the global average. • Although China has a lot of cloud cover currently as a result of aerosols, they have very little rainfall. • This is because the large amount of particles provides many nucleation sites where cloud droplets can form, thereby making it harder for small droplets to grow big enough to drop out of clouds as rain. • With rising AOT numbers, China’s clean air days, where there is at least 75% visibility, has declined rapidly to 14% in 2007 in eastern central China • The effects of inhaling these particles include asthma, lung cancer, cardiovascular issues, and premature death. • Aerosols have also been known to clog the stomata openings of plants and to interfere with photosynthesis, leading to stunted plant growth and plant mortality.
2008: Beijing Olympics In effort to clean the air and fulfill its promise of a “Green Olympics”, China implemented alternate day car usage, and relocated the worst polluting factories. For the chance to host the Olympics, it was agreed that articulate matter — dust and grit would "reach the level of major cities in developed countries." Long term efforts for cleaner air include: building a subway, planted millions of trees, installing scrubbers in the city’s big power plants, and expanding its public bus line. Negative Points: Beijing’s cars continued to add to smog, power plants were under intense pressure from energy use especially in hot days, polluting factories moved temporarily to neighboring cities to continue consuming records amount of coal. Athletes in Beijing faced pollution levels that were up to 3.5 times higher than those in recent Olympic cities like Athens, Atlanta and Sydney, said the study published in the journal Environmental Science and Technology. The pollution often exceeded what the World Health Organization considers safe. After the fact: Car ban was lifted, factories returned, and smog is still a problem in Beijing The Olympics signaled a shift in Chinese air pollution control policies from lax to stringent. Analysis: Particulate matter increases sharply in the months before the August 2008 Olympics, especially in the months of May and June. However, particulate cover noticeably diminishes throughout the country in the months following the August Games as the effects of pollution control carries over. A 2009 satellite image one year later however, shows that they have not maintained their air standards, although particulate presence has certainly remained more constrained than previously.
What is the Chinese government doing to fight air pollution? • China's air quality has improved only marginally over the past decade • Between 2000-2005, the number of heavily polluted cities decreased by 40% • Most preventative action has been taken by cities, not by the government • First law for controlling air pollution was passed in 1987 - revised in 1995 • In 2000, the more effective Law on the Prevention and Control of Air Pollution was passed • Requires industry to use energy-efficient and low-pollution technology • Lists of outdated equipment are published regularly • Makes the production of high-sulfur and ash coal more expensive by requiring its washing - should lead to wider usage of more efficient coal • As of January 2007, new apartment and office buildings must meet energy efficiency standards and owners of existing constructions will spend about $200 million to improve efficiency before 2020. • To cut down on transportation energy, electric lines have been introduced to many local neighborhoods, and in some cities, people are not allowed to drive gasoline fueled cars and mopeds in the city centers. • These measures, along with many more have led to reduction in sulfur dioxide emissions for 23 million tons in 1995 to 19 million tons in 2004.
Environmental Policy in China: Is it working? As we mentioned earlier, in the past decade or so, China has been trying to adopt a more green environmental policy by passing regulations to raise environmental standards and by targeting offenders. However, the growing industry of China is still far from being energy efficient, and continues to pollute the nation’s atmosphere at dangerously high levels. Seventy percent of China’s total energy is still coal-based, and acid rain continues to fall on 30% of the country. Occasionally, airports in Shanghai and Beijing have to shut down because of such poor visibility. These and many more Chinese practices are keeping the skies dark across the country, despite the nation’s recent efforts to combat air pollution. By comparing 2005 AOT levels to 2010 levels, we saw that there has been little noticeable change in China’s air quality over the past decade.
AOT Levels: 2005, 2010 2005 2010
Conclusion By looking at Aerosol Optical Thickness data and CO levels, we can see that China still has a long way to go before it can have clean, safe air for its citizens to breathe. Cities in China are main polluters, and therefore the strictest measures must be taken in these high density areas in order for significant environmental change to take place. Hopefully though, the actions taken in the last few years to clear China’s air will be built upon in the years to come and will lead to a healthier global atmosphere.
Bibliography 1. "Aerosol Optical Thickness — GES DISC: Goddard Earth Sciences, Data & Information Services Center." GES DISC Home Page — GES DISC: Goddard Earth Sciences, Data & Information Services Center. Web. 19 Jan. 2011. <http://disc.sci.gsfc.nasa.gov/data-holdings/PIP/aerosol_optical_thickness_or_depth.shtml>. 2. "Air Pollution | Greenpeace East Asia." Inspiring Action for a Green and Peaceful Future | Greenpeace USA. Web. 19 Jan. 2011. <http://www.greenpeace.org/eastasia/campaigns/air-pollution>. 3. "Air Pollution in China." Encyclopedia of Earth. Web. 19 Jan. 2011. <http://www.eoearth.org/article/Air_pollution_in_China>. 4. "Air Pollution in China Reduces Rainfall." Conservation and Environmental Science News. Web. 19 Jan. 2011. <http://news.mongabay.com/2009/0831-china.html>. 5. "China Now No. 1 in CO2 Emissions; USA in Second Position - PBL Netherlands Environmental Assessment Agency." PlanbureauVoor De Leefomgeving. Web. 19 Jan. 2011. <http://www.pbl.nl/en/news/pressreleases/2007/20070619Chinanowno1inCO2emissionsUSAinsecondposition>.
Bibliography (Con’t) 6. "China Says Air Pollution Worsening." PhysOrg.com - Science News, Technology, Physics, Nanotechnology, Space Science, Earth Science, Medicine. Web. 19 Jan. 2011. <http://www.physorg.com/news199429962.html>. 7. "China's Health and Environment: Air Pollution and Health Effects | World Resources Institute."World Resources Institute | Global Warming, Climate Change, Ecosystems, Sustainable Markets, Good Governance & the Environment. Web. 19 Jan. 2011. <http://www.wri.org/publication/content/8416>. 8. "Chinese Air Pollution Deadliest in World, Report Says." Daily Nature and Science News and Headlines | National Geographic News. Web. 19 Jan. 2011. <http://news.nationalgeographic.com/news/2007/07/070709-china-pollution.html>. 9. Economy, Elizabeth C. "Chinas Environmental Crisis." Council on Foreign Relations. Web. 19 Jan. 2011. http://www.cfr.org/publication/12608/chinas_environmental_crisis.html. 10. NEO: Welcome to NASA Earth Observations. Web. 19 Jan. 2011. <http://neo.sci.gsfc.nasa.gov/Search.html?group=5>.