Download
1 / 21
210 likes | 224 Vues
This study examines the limitations of historical reconstructions using indirect evidence and model-based simulations. It compares the temperature variations derived from historical evidence with simulations from models like "Erik den Røde" and "Christoph Columbus." The findings highlight the challenges of accurately reproducing historical climate using regression-based methods and the need for high correlation or process-based inverted data for reliable centennial-scale reconstructions.

E N D
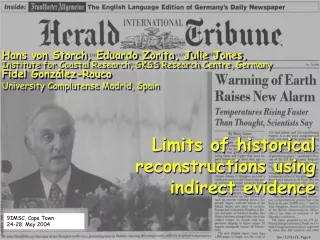
Limits of historical reconstructions using indirect evidence Hans von Storch, Eduardo Zorita, Julie Jones, Institute for Coastal Research, GKSS Research Centre, GermanyFidel González-Rouco University Complutense Madrid, Spain 9IMSC, Cape Town24-28. May 2004
ECHO-G simulations „Erik den Røde” (1000-1990) and “Christoph Columbus” (1550-1990) with estimated volcanic, GHG and solar forcing
Reconstruction from historical evidence, from Luterbacher et al. Late Maunder Minimum Model-based reconstuction 1675-1710vs. 1550-1800
Both, Erik den Røde and Christoph Columbus generate temperature variations considerably larger than standard reconstructions (Mann, Jones …). The simulated temperature variations are of a similar range as derived from NH summer dendro-data and from terrestrial boreholes.
For the present context, it does not really matter how „good“ the historical climate is reproduced by Erik den Røde and Christoph Columbus. The model data provide a laboratory to test MBH and other methods.
Testing the MBH method pseudo-proxies: grid point SAT plus white noise red: mimicking largest sample used in MBHblue: hypothetic additional data to obtain better coverage.
Estimated NH SAT from terrestrial deep soil temperature (TDST) in Erik den Røde.
Conclusion, 1 • Erik den Røde, an effort to simulate the response to estimated volcanic, GHG and solar forcing, 1000-2000. • Low-frequency variability in Erik den Røde > Mann, Jones, & mainstream, but ~ Esper, boreholes, (some) instrumental data
Conclusion, 2 • Erik den Røde-data used to test MBH and borehole approaches. • Randomized grid-point SAT (i.e. white noise added) is used as pseudo proxy. • MBH method, based on regression, gives significant underestimation of low-frequency NH mean SAT. • Direct averaging of randomized local data results in considerably smaller errors in NH mean SAT.
Conclusion, 3 • When using Erik den Røde-data and pseudo-proxy data, which share a correlation of about 0.5 with the grid point data, the best guess resembles the MBH estimate (incl. the ±2σ confidence band). • The problem is common to ALL regression based methods, trained with temporal high-resolution data – except if the correlations are really high. • A reliable reconstruction of centennial time scales requires either really high correlation, or process-based inverted data (e.g., borehole inversions), or local instrumental data.
Testing with HadCM3 simulation Erik HadCM3 Data provided by Simon Tett.