Download
1 / 22
230 likes | 348 Vues
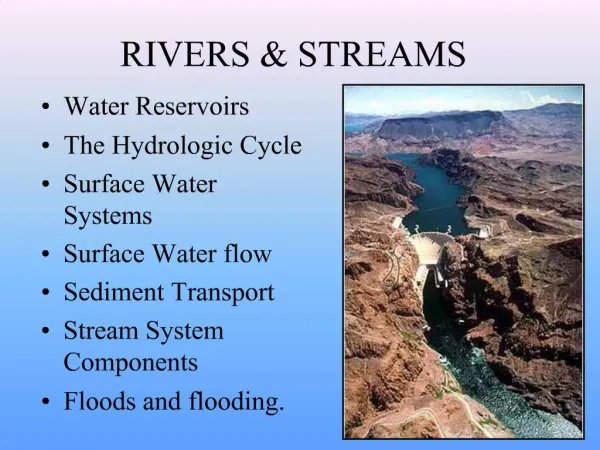
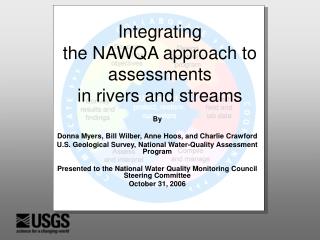
Integrating the NAWQA approach to assessments in rivers and streams. By Donna Myers, Bill Wilber, Anne Hoos, and Charlie Crawford U.S. Geological Survey, National Water-Quality Assessment Program Presented to the National Water Quality Monitoring Council Steering Committee October 31, 2006.

E N D
Integratingthe NAWQA approach to assessmentsin rivers and streams By Donna Myers, Bill Wilber, Anne Hoos, and Charlie Crawford U.S. Geological Survey, National Water-Quality Assessment Program Presented to the National Water Quality Monitoring Council Steering Committee October 31, 2006
Occurrence of Pesticides in Water; 1992-2001 Land use Streams Shallow Ground Water Agricultural Streams Shallow Ground Water Urban Streams Shallow Ground Water Undeveloped Streams Major Aquifers Mixed 0 50 100 Percentage of Samples with Detections (from Pesticides in the Nation’s Streams and Ground Water, 1992-2001, USGS Circular 1291)
Common Pesticides in Streams Agricultural Urban Atrazine Metolachlor Cyanazine Simazine Prometon Tebuthiuron Diazinon Chlorpyrifos Carbaryl 0 50 100 0 50 100 Percentage of Samples with Detections (from Pesticides in the Nation’s Streams and Ground Water, 1992-2001, USGS Circular 1291)
Potential of Pesticides to Affect Aquatic Life Water Bed Sediment Agricultural Water Bed Sediment Urban Water Bed Sediment Undeveloped Water Bed Sediment Mixed 0 50 100 Percentage of Sites Exceeding Benchmarks (from Pesticides in the Nation’s Streams and Ground Water, 1992-2001, USGS Circular 1291)
PESTICIDE CONCENTRATIONS FOLLOW SEASONAL PATTERNS 5 AGRICULTURAL STREAMS 4 3 2 1 TOTAL PESTICIDE CONCENTRATION, ug/L 0 1 2 3 4 5 6 7 8 9 10 11 12 5 URBAN STREAMS 4 3 2 1 0 1 2 3 4 5 6 7 8 9 10 11 12 MONTH (from Pesticides in the Nation’s Streams and Ground Water, 1992-2001, USGS Circular 1291)
Trends in Corn-Belt Herbicides 1 Alachlor Cyanazine 0.1 Herbicide Use 0.01 Acetochlor 0.001 1 0.1 Stream Concentrations 0.01 0.001 1992 1994 1996 1998 2000 (from Pesticides in the Nation’s Streams and Ground Water, 1992-2001, USGS Circular 1291)
1991-2000 2001-2004 2005-2006
Change No. 2 – Moving from “monitoring” to “monitoring and modeling” Prediction of Atrazine in Streams (from Pesticides in the Nation’s Streams and Ground Water,1992-2001, USGS Circular 1291)
Three major points • Benefits of integrating monitoring with modeling • The value that we gained from collaborating with other Federal and State agencies and integrating NAWQA data with data collected by these other programs. 3. The applicability of the regional-scale assessment
Change No. 3 – Use of other sources of data outside NAWQA Estimate of nutrient load NAWQA: 44 Other USGS: 174 Other agency: 586 (matched to USGS gage)
SPARROW Model Framework Spatial Data Layers Monitoring Data 804 Sites Model Predictions 8,092 Stream Reaches
Sources accounting for instream nitrogen load Atmospheric depositionAgricultural landDeveloped landPoint-source discharge of wastewater
Prediction Error Based on all sites + 30% NAWQA site with nutrient-load estimate
Assessment of Total Nitrogen Concentration Percent of 72,000 stream miles Mean concentration, in 2002 < 0.7 mg/L 39 % > 0.7 mg/L 61 %
Sensitive Coastal Areas Yield delivered to estuary from watershed, kg/yr/ha < 2 2 – 4 4 – 8 > 8 Estuary condition, 1999 Eutrophic, influenced by nitrogen input
Source Shares Delivered to Sensitive Coastal Areas Cape Fear Estuary Savannah River Estuary Mobile Bay Atmospheric deposition Agricultural sources Runoff from developed land Point-source discharge
Summary 1. Improved understanding through integration of monitoring and modeling2. Integrated data sets3. Enhanced decision-making