Understanding Probabilities and Distributions in Ecological Studies
260 likes | 396 Vues
This lecture explores the fundamentals of probabilities and distributions, focusing on their applications in ecological studies. It discusses the definition of probability, including the stochastic approach, and provides an example of calculating winning odds in the Duży Lotek lottery using Bernoulli and hypergeometric distributions. Additionally, it covers methods for capturing and recapturing populations, assessing species composition across habitats, and highlights important considerations when collecting and analyzing ecological data. Key aspects of research design and statistical evaluation are also addressed.

Understanding Probabilities and Distributions in Ecological Studies
E N D
Presentation Transcript
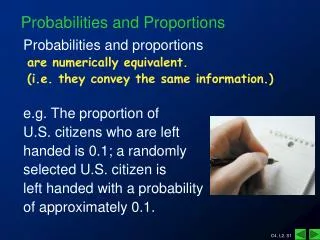
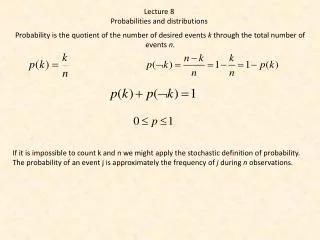
Lecture8 Probabilities and distributions Probabilityisthequotient of thenumber of desiredeventskthroughthetotalnumber of eventsn. Ifitisimpossible to count k and n we mightapplythestochasticdefinition of probability. Theprobability of an event j isapproximatelythefrequency of jduringnobservations.
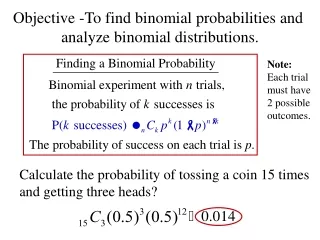
What is the probability to win in DużyLotek? We needthenumber of combinations of k events out of a total of N events Bernoulli distribution Thenumber of desiredeventsis 1. Thenumber of possibleeventscomesfromthenumber of combinations of 6 numbers out of 49.
What is the probability to win in DużyLotek? We needtheprobabilitythat of a sample of Kelements out of a sampleuniverse of Nexactlynhave a desiredprobability and k not. Wrong! K=n+k n N Hypergeometric distribution P = 0.0186
Assessingthenumber of infectedpersons Assessingtotalpopulationsize We take a sample of animals/plants and markthem We take a secondsample and countthenumber of markedindividuals Capture – recapturemethods Thefrequency of markedanimalsshouldequalthefrequencywothinthetotalpopulation Assumption: Closedpopulation Random catches Random dispersal Markedanimals do not differinbehaviour Nreal = 38
Thetwosamplecase How many personshave a certaininfectuousdesease? Youtaketwosamples and countthenumber of infectedpersonsinthe first sample m1, inthesecondsample m2 and thenumber of infectedpersonsnotedinbothsamples k.
In ecology we oftenhavethe problem to comparethespeciescomposition of twohabitats. Thespeciesoverlapismeasured by theSoerensendistancemetric. We do not knowwhether S islargeorsmall. To assesstheexpectation we construct a null model. Bothhabitatscontainspecies of a commonspeciespool. Ifthepoolsize n isknown we canestimatehow many joint species k containtwo random samples of size m and l out of n. Habitat B Habitat A k species l species m species n species Commonspeciespool Theprobability to getexactly k joint species. Probabilitydistribution. Theexpectednumber of joint species. Mathematicalexpectation
Groundbeetlespecies of twopoplarplantations and twoadjacentwheetfields near Torun (Ulrich et al. 2004, AnnalesZool. Fenn.) Poolsize 90 to 110 species. Thereare much morespeciesincommonthanexpectedjust by chance. Theecologicalinterpretationisthatgroundbeetlescolonizefields and adjacentseminaturalhabitatsin a similarmanner. Groundbeetles do not colonizeaccording to ecologicalrequirements (niches) but according to spatialneighborhood.
How to perform a biological study Definingthe problem Identifyingthe state of art Literature Formulatingspecifichypothesis to be tested Theory Study design, poweranalysis, choosingtheanalyticalmethods, design of the data base, Planning Observations, experiments Meta analysis Data Statisticalanalysis, modelling Analysis Comparingwithcurrenttheory Interpretation Scientific writing,expertise Publication
Preparing the experimental or data collecting phase • Let’s look a bit closer to data collecting. Before you start any data collecting you have to have a clear vision of what you want to do with these data. Hence you have to answer some important questions • For what purpose do I collect data? • Did I read the relevant literature? • Have similar data already been collected by others? • Is the experimental or observational design appropriate for the statistical data analytical tests I want to apply? • Are the data representative? • How many data do I need for the statistical data analytical tests I want to apply? • Does the data structure fit into the hypothesis I want to test? • Can I compare my data and results with other work? • How large are the errors in measuring? Do theses errors prevent clear final results? • How large might the errors be for the data being still meaningful?
Scientific publications of any type are classically divided into 6 major parts • Title, affiliations and abstract In this part you give a short and meaningful title that may contain already an essential result. The abstract is a short text containing the major hypothesis and results. The abstract should make clear why a study has been undertaken • The introduction The introduction should shortly discuss the state of art and the theories the study is based on , describe the motivation for the present study, and explain the hypotheses to be tested. Do not review the literature extensively but discuss all of the relevant literature necessary to put the present paper in a broader context. Explain who might be interested in the study and why this study is worth reading! • Materials and methods A short description of the study area (if necessary), the experimental or observational techniques used for data collection, and the techniques of data analysis used. Indicate the limits of the techniques used. • Results This section should contain a description of the results of your study. Here the majority of tables and figures should be placed. Do not double data in tables and figures. • Discussion This part should be the longest part of the paper. Discuss your results in the light of current theories and scientific belief. Compare the results with the results of other comparable studies. Again discuss why your study has been undertaken and what is new. Discuss also possible problems with your data and misconceptions. Give hints for further work. • Acknowledgments Short acknowledgments, mentioning of people who contributed material but did not figure as co-authors. Mentioning of fund giving institutions • Literature
Thesource data base Neverusetheoriginal data base for calculations. Useonly a replicate. Take care of emptycells. In calculatedcellstakecare of impossiblevalues. Eachrowgets a single data record. Columnscontainvariables. Variablescan be of textormetrictype.
Cumulativefrequencydistribution Frequencydistribution
Discrete and continuousdistributions Probabilitygeneratingfunction (pgf) Continuousdistribution Discretedistribution Probability densityfunction(pdf) Statisticalorprobabilitydistributionsaddup to one.
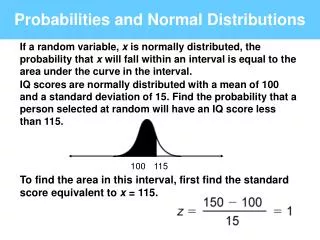
Many statisticalmethodsrely on a comparison of observedfrequencydistributionswiththeoreticaldistributions. Deviationsfromtheory (fromexpectation) (so calledresiduals) aremeasures of statisticalsignificance. Df(x) Df(x) IftheDf(x) aretoolarge we acceptthehypothesisthatourobservationsdifferfromthetheoreticalexpectation. The problem instatisticalinferenceis to findtheappropriatetheoreticaldistributionthatcan be applied to our data.
Home work and literature • Refresh: • Arithmetic, geometric, harmonicmean • Variance, standard deviation standard error • Central moments • Third and fourth central moment • Mean and variance of power and exponentalfunctionstatisticaldistributions • Pseudocorrelation • Samplebias • Coefficient of variation • Representativesample • Prepare to thenextlecture: • Bernoulli distribution • Pascal distribution • Hypergeometricdistribution • Linear random number Literature: Mathe-online Łomnicki: Statystyka dla biologów.