Download
1 / 11
110 likes | 127 Vues
Explore the relationships among probability distributions including Gaussian, Uniform, and Rayleigh. Learn how to interpret measurements and use statistical tests such as T-test, F-test, Chi-Square test, Anova, and Pearson's Correlation Coefficient.

E N D
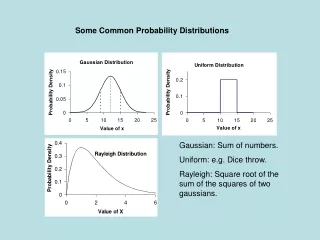
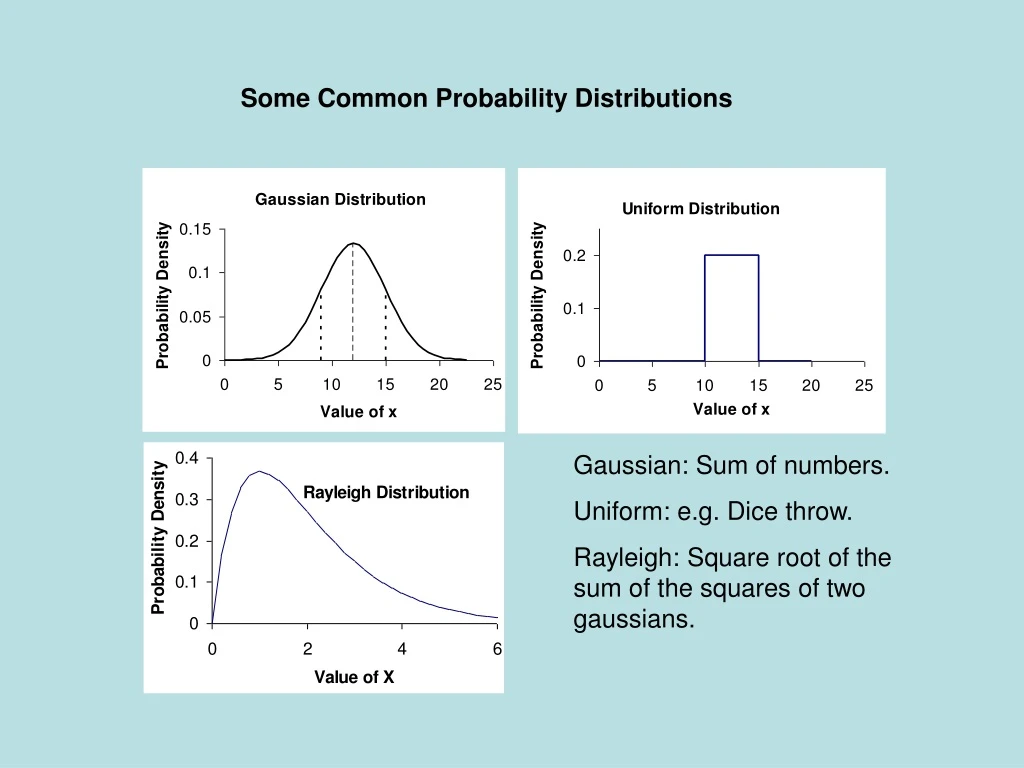
Some Common Probability Distributions Gaussian: Sum of numbers. Uniform: e.g. Dice throw. Rayleigh: Square root of the sum of the squares of two gaussians.
Relationships Among Probability Distributions Assume that are uniformly distributed. Then: Is Gaussian (Normal) distributed for N sufficiently large. Is distributed. Is Rayleigh distributed.
What could you conclude if you made a single measurement and the value fell as follows on the expected distribution?
What if three values fell as follows on the expected distribution?
If two data sets gave the following measurements, would you conclude that they came from different distributions? What if the data looked like this?
How confident are you that the data sets in each plot below come from different distributions? Lower standard deviation Smaller difference in means Fewer data points
Students T test measures the confidence you can have that two values are inherently different, based on three parameters • Difference of the means • Standard deviations • Number of data points obtained • Particularly useful when there are multiple confounding variables. • E.g. Blood cholesterol drugs – are we, on average, lowering blood pressure?
Students T test is used to answer the following question: • Given: • Difference of the means • Standard deviations • Number of data points obtained • That these data come from normal distributions • What is the probability (p) that they came from different underlying distributions?
Example Given the mean and standard deviation for pressure, along with the number of points measured from a clinical drug trial, what is the probability (p) that the drug had an effect on the distribution (i.e. that it changed the blood pressure of these individuals on average). Sample Mean: Mean from the sample that was taken (the 2000 people in the drug trial). Distribution Mean: Mean that would occur if you could give the drug to everyone in the world and do the measurement.
Statistical Tests You Should Know • T-test: Are the means of two data sets the same? • F-test: Are the standard deviations of two data sets the same? • Chi-Squred Test: Does the distribution of a data set match a proposed distribution? • Anova: Like an F-test for multiple variables. • Pierson’s Correlation Coefficient: Does one variable depend on another?