Meditech EMR Review
1.56k likes | 3.13k Vues
Meditech EMR Review. Computer Based Tutorial. Lesson Review. This lesson will describe: What the EMR is Where the EMR is located How to access the EMR How to view results and documentation in the EMR. What is the EMR?.

Meditech EMR Review
E N D
Presentation Transcript
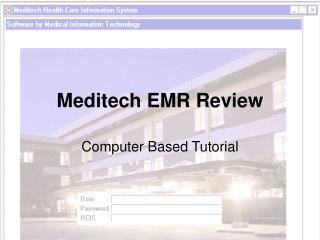
Meditech EMR Review Computer Based Tutorial
Lesson Review This lesson will describe: • What the EMR is • Where the EMR is located • How to access the EMR • How to view results and documentation in the EMR
What is the EMR? • EMR stands for Enterprise Medical Record. It is also known as “Open Chart” in Meditech, because it is where you find your completed documentation. • The EMR is the place where patient documentation and results can be accessed and viewed, including lab/microbiology/pathology results, the patient’s order history and medications, reports, and a patient summary.
The EMR is accessed though the Meditech system. To access the EMR, you will double click on the Meditech Icon on your desktop.
This will open the window where you type your User ID and password. • Your User ID is the letter E followed by your 5 digit employee number with no spaces in between. • You should have chosen your password in computer class or your manager will help you set this up. e12345 ******
Once you have logged into Meditech using your login and password, you will be able to see your Meditech desktop. • To access a patient's current visit documentation, you will click on the PCS Worklist button. • The EMR for previous visit information can also be accessed through the EMR button.
To access the EMR, you can also click on the EMR icon on the toolbar (right side of screen) or press F11 on your keyboard.
Once the EMR has been opened, the first screen you will encounter is the recently accessed records list. • This screen shows you a list of patients whose records you have viewed recently.
You may choose a patient from this list, or use one of the . EMR panel selections on the right side menu to choose . another patient.
You will notice that when you place the cursor over an active button, like the Any Location button, the cursor turns into a hand with a pointing finger. Whenever you see the cursor turn into a hand, you will know that you are over a “clickable” area.
To choose a patient according to where they are located, you will click on the Any Location button.
First you will have to select the appropriate facility for your patient. We will use Greater Baltimore Medical Center to locate our patient.
You are presented with a list of possible patient locations from which you must make a selection. Our patient resides on U 48 General Medicine. We will make that selection now.
To select a patient, from this menu or any other patient selection list, point anywhere within the box with the patient’s name and click. Our practice patient today is Apple Green. We will click on his name now.
You will now have the option to choose the appropriate patient visit or encounter. Our patient has 5 recent visits – 2 as an inpatient, 1 provider visit, 1 clinical visit, and 1 ER visit. • The icons, or pictures, to the left of each admission will help you select the correct visit.
The patient bed is the symbol for inpatient accounts. The green dot means that this is the current patient visit. If there is not a green dot, it means the patient has been discharged or that the outpatient account is not active.
Here are some of the other symbols you may see indicating different types of patient visits.
If you are interested in viewing a collection of information that includes data from multiple patient visits at once, you would click on the View All Visits button on the EMR toolbar.
If you are interested in viewing the data from more than one visit but not all visits, click in the empty box to the right side of the visit to indicate that you want to see info from that visit. Doing so marks the box with an X, as shown here.
When an X appears in the white box, the View X Visits becomes active on the EMR panel menu. Clicking on that selection will present you with information from only the visits you selected.
For this lesson, we will review the information from the patient’s current active inpatient account. To select this visit, we will click on the admitted inpatient visit, highlighted here.
Before we look into our patient’s electronic record, let’s learn the other ways to look up a patient. • The 2nd option is by using Any Record. If you do not know exactly where the patient is located, but DO know the name, medical record number, social security number, or other significant identifier, use the Any Record button.
You may use any of these fields alone or in combination to select the patient’s record. Some searches will be more exact than others.
Here we will enter the patient’s name with the last name and first initial separated by a comma and without any spaces.
Our search yields one patient match. • The whole or partial name search will find every patient with the first and last name that match the letters you specified. • We choose the patient we want by clicking anywhere on the name / patient record.
Once you have selected your patient and clicked on the appropriate visit, the EMR will open on your screen.
If there are any new results for your patient from the past 24 hours, you will first be directed to the 24 hour detail screen. • Our patient does not have any recent results, so we are seeing the “My Panel” view. • You can learn how to build a customized My Panel by going to the Meditech help link on the Nursing web page on the Infoweb.
The option on the right side menu that is highlighted white (in this case Special Panels) is the information you are currently viewing in the center of the screen. By default, we are viewing the My Panel section of the Special Panels. Let’s click on Special Panels to see the other Special Panel options.
While in the EMR, you will notice that the upper menu options change according to the active content on the screen. • Headers will turn white when you click on them and the material listed in the header will show up in the middle of the screen. • Let’s click on Cardiac and see what happens.
Now we see the Cardiac Panels listed below the upper menu options. If we wanted to view one of these panels, all we would have to do is click on it and the information would appear in the center of the screen.
Allergy Information can be found at the top of the screen in the light blue patient information area. To access the allergies mode, you can click on the small blue circle and the allergy screen will open.Let’s see what that would look like now.
Clicking on the Allergies button will show you the allergies that have been entered for the patient. These allergies are checked by pharmacy for possible interactions with the patient's ordered meditations. • You will learn more about entering allergies in the order management lesson.
If there are new results since the last time you viewed the patient’s information, the appropriate result titles will appear in red in the right side panel menu.
Let’s take a look at what can be found by clicking on different options in the menu on the right side of the EMR.
The vital signs menu option displays all recent vital sign values that have been documented in PCS. Each column represents a different instance of documentation. • The most recent instance appears in the far right column.
The yellow background means more detailed information is available. You can view more information for any of the Vital Signs parameters by clicking on them.
We will use this example to show what would happen if we clicked on the word temperature.
The history screen for temperature shows several days worth of data in a table format. You can easily see changes in the temperature over time, with the most recent results located at the top of the screen.
Values that are out of range appear in yellow boxes. • High values will be indicated by the letter H and low values indicated by the letter L.
On this screen we can also see the normal reference range for the temperatures.
The I&O panel shows the intake and output as it is charted in PCS. • The first view shown is the 24 hour view, which is from midnight to midnight.
To change the time view, you can click on any of the available time frame headers at the top of the screen.
As always, you can view more details of any data item that has a yellow background. • Let’s see what appears when we click on Intake: Oral
This opens up details regarding the patient’s Oral intake documentation. • To view a complete snapshot of the oral intake documentation, you could click on the blue circle at the end of the row.
The notes menu gives you the opportunity to view notes entered by all disciplines that currently document patient notes online.
Some examples are nursing, physical therapy, respiratory therapy, and nutrition. • If you only want to see notes from one discipline, you can narrow the view on the screen by clicking on a specific header at the top of the screen.