Understanding Scatter Diagrams & Correlation in Statistics
160 likes | 278 Vues
Learn how to create scatter diagrams, find correlation coefficients, and test for linear relationships in data sets. Understand the distinction between correlation and causation in statistical analysis.

Understanding Scatter Diagrams & Correlation in Statistics
E N D
Presentation Transcript
Section 4.1 Scatter Diagrams and Correlation
Definitions • The Response Variable is the variable whose value can be explained by the value of the explanatory or predictor variable.
Scatter Diagram • A graph that shows the relationship between two quantitative variables measured on the same individual. Each individual in the data set is represented by a point in the scatter diagram. The explanatory variable is plotted on the horizontal axis and the response variable is plotted on the vertical axis.
Finding Scatter Diagram • Put x values (explanatory variable) into L1 • Put y values (response variable) into L2 • “2nd” button, “y=“ button • “Enter” on 1: Plot1 • Choose “On”, “1st type”, L1, L2, “1st mark” • “Zoom” -> ZoomStat
Positively vs. Negatively Associated • Positively Associated = As the x value increases, the y value increases • Negatively Associated = As the x value increases, the y value decreases where x = explanatory variable, y = response variable
Sample Linear Correlation Coefficient (r) or Pearson Product Moment Correlation Coefficient
Sample Linear Correlation Coefficient (r) or Pearson Product Moment Correlation Coefficient (shortcut formula)
Linear Correlation Coefficient • Aka (Pearson Product Moment Correlation Coefficient) = a measure of the strength of the linear relation between two variables. • Represented by r • Between -1 and 1 (including -1 and 1) • -1 represents perfect negative correlation, 1 represents perfect positive correlation
Finding r • Put x values (explanatory variable) into L1 • Put y values (response variable) into L2 • “Stat” button • Right arrow to CALC • Down arrow to LinReg (ax + b) • “enter” button • “enter” button * Make sure Diagnostics is On
Testing for a Linear Relation • Determine the absolute value of the correlation coefficient |r| • Find the critical value (CV) in Table II from Appendix A for the given sample size • if |r| > CV : linear relation existsif |r| < CV : no linear relation exists
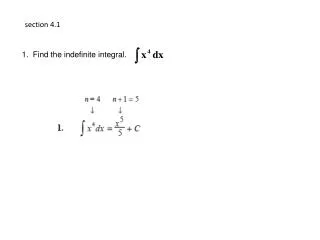
4. Test to see if there is a linear relation between x and y
Correlation versus Causation Note: A linear correlation coefficient that implies a strong positive or negative association does not imply causation if it was computed using observational data