Download
1 / 42
470 likes | 692 Vues
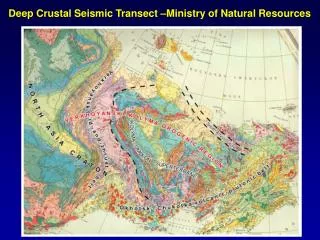
Rio Grande Seismic Transect (RISTRA) Overview. Collaborators: Rick Aster 1 , Scott Baldridge 2 , Rengin Gok 3 , Steve Grand 4 , Joe Leon 1 , Jim Ni 3 , Eric Sandvol 5 , Steve Semken 6 , Frederik Tilmann 3 , Gao Wei 4 , Mike West 3 , Dave Wilson 1

E N D
Rio Grande Seismic Transect (RISTRA) Overview Collaborators: Rick Aster1, Scott Baldridge2, Rengin Gok3, Steve Grand4, Joe Leon1, Jim Ni3, Eric Sandvol5, Steve Semken6, Frederik Tilmann3, Gao Wei4, Mike West3, Dave Wilson1 1NMT, 2LANL, 3NMSU, 4UT, 5Missouri, 6Dine Supported by LANL and NSF Geophysics
Issues • What is the relative role of mantle processes (upwellings, downwellings, mantle modification) driving surface tectonics versus crustal processes (gravity collapse, changes in boundary conditions). • What is the cause of mantle seismic anomalies (temperature, melt, composition, anisotropy, mineralogy, fractures, fluids …) and how did these anomalies get created? • Is western U.S. proterozoic lithosphere permanent? How important are ancient lithosphere properties in controlling tectonics versus more juvenile alterations due to flat slab subduction.
The LA RISTRA network • The Colorado Plateau, Rio Grande rift, Great Plains, Seismic Transect Experiment • 57 seismic station, 950 km long, passive PASSCAL experiment (54 stations on main transect). • 18.1 ± 3.6 km station spacing meters
RISTRA stations • All stations equipped with STS-2 (120 s) seismometers from PASSCAL • Hand dug vaults • Powered by batteries and solar panels • Continuously recording ground motion at 20 samples/second
RISTRA Data • The network was deployed from July, 1999 through May, 2001. • 401 earthquakes with mb ≥ 5.6 and 129 earthquakes with mb ≥ 6.0 were recorded by RISTRA instruments • RISTRA is approximately on-azimuth for Alaskan/South American earthquakes. mb ≥ 6.0
Tectonic History • Before 100 Ma – Plateau to Great Plains similar topography – below sea level • Laramide orogeny – ~70-50 Ma Rocky Mountains formed – Plateau was trough within mountains • Ignimbrite Flareup - ~40-20 Ma large scale magmatic activity • 10-20 Ma – tectonic quiescence at least in rift • Last 10 Ma – rift magmatically active especially along Jemez lineament – possible plateau uplift, southern Rocky uplift
Flat slab subduction – roll back – from Humphreys et al., 2004
LA RISTRA scientific targets: • To what depths are mantle processes controlling surface tectonics? • What is the connection between mantle and crustal strain beneath the Rio Grande rift region? • What is the cause of the anomalously high elevation (~2 km above sea level) of the Colorado Plateau? • Where in the mantle are the remnants of the Farallon plate and any possible detached continental lithosphere?
RISTRA Ongoing Data Analysis • Receiver function imaging of crust and mantle (Wilson et al.). • Surface wave analysis (West et al.). • Teleseismic tomography (Gao et al.). • Mantle shear wave anisotropy analysis (Gok et al.).
Deconvolution of teleseismic body waves to produce a receiver function • Receiver functions are calculated by deconvolving the vertical seismogram from the radial horizontal seismogram. R(w) source * path * horizontal earth response near receiver V(w) source * path * vertical earth response near receiver = H(w)= This leaves a seismic trace which is only a function of the Earth’s structure near the receiver, a “Receiver Function”. • Receiver functions isolate near surface (crust and upper mantle) structure from teleseismic body waves.
Raypaths for commonly observed receiver function phases. • (ray paths are perpendicular to the wave fronts). • Timing of receiver function phases depends on: • P-wave velocity • S-wave velocity • Depth to the discontinuity • Distance to earthquake (incidence angle of the incoming wavefield). Ray paths Earth’s Surface Receiver Function
Receiver function migration • Kirchhoff style pre-stack depth migration. • Each of the three typically observed phases is migrated onto a separate output grid. • Output grids can then be compared to validate velocity model, or stacked to reduce imaging artifacts.
Ps migration PpPs migration -1*(PsSs + PsPs) migration Delaware Basin basin multiple (imaging artifact) Moho Sub-crustal discontinuities? crust multiples (imaging artifacts) Delaware Basin Moho Sub-crustal discontinuities? Delaware Basin Moho Sub-crustal discontinuities? Receiver Function Amplitude - +
Migrated cross section with imaging artifacts suppressed • Where the different receiver function phases align at the same depth, they will stack constructively, minimizing imaging artifacts. Station # Colorado Plateau Great Plains RGR Basin Multiples attenuated Moho Sub-crustal discontinuities Receiver Function Amplitude
Upper mantle receiver function image (Ps migration) Colorado Plateau RGR Great Plains 270 km 410 km 670 km longitude Receiver Function Amplitude
Rayleigh Wave Phase Velocities Measured over 5 station intervals – 1D inversion of phase velocities assigned to mid-point
Surface Waves: Upper Mantle Surface Wave Model Colorado Plateau Rio Grande Rift Great Plains West et al.
West (2004) using shear velocities and results from Cammarano et al. (2003) made a temperature model
Symmetry about rift – seems to imply pure shearing Pure shear Simple shear
Tomography: Travel Time Tomography • Measure relative delay times for P and S-waves recorded at each station • Project the delay times back along the incoming raypaths (in the form of velocity perterbations).
Tomography: Travel Time Tomography • Measure delay times for many different events, from a range of distances, which have many crossing raypaths. • Solve for the velocity model which best fits the observed delay times.
Tomography: P-wave tomography results S-wave tomography results
Navajo Volcanic Field – Xenoliths show Proterozoic Age at 140 km depth – Came up 25 Ma (Smith et al., 2004)
Shear wave splitting – fast direction shown Fracture orientation? Alignment of b-axis with flow – like subduction zones? (Mehl et al. 2003; Mizukani et al. 2004)
Conclusions Extension of the lithosphere • Ductile stretching in lower crust • Pure shear rifting mode Mantle structure of the rift • No plume or deep mantle source • Large variation in lithosphere to 150 km depth • Downwelling on eastern edge of rift Present dynamics • Possible small scale convection driven by downwelling on eastern edge of rift • Upwelling under Plateau – maybe associated with Farallon plate • Lithosphere under rift removed by flow