Download
1 / 26
260 likes | 381 Vues
This article by Jane E. Miller, PhD provides an overview of the strengths and weaknesses of tables, charts, and prose for organizing and conveying numeric information. It discusses the ways in which different types of variables affect the choices for the most effective ways to organize data in a table or chart. The article also explores the principles for organizing variables in tables or charts, including those accompanied by narrative explanation and user-guided data lookup.

E N D
Organizing data in tables and charts:Different criteria for different tasks Jane E. Miller, PhD
Overview • Review of strengths and weaknesses of tables, charts, and prose for organizing and conveying numeric information. • Ways that different types of variables affect choices for the most effective ways to organize data in a table or chart. • Principles for organizing variables in tables or charts: • For those accompanied by narrative explanation. • For user-guided data look up.
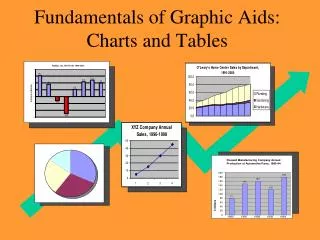
Complementary use of prose, tables and charts • Use tables and charts to present full set of numeric values. • Use prose to • describe the pattern, • address the hypothesis. • Use same ordering principle in table or chart and its accompanying prose. • Improves clarity of narrative line.
Why does order of variables matter? • The arrangement of items in a table or chart should coordinate with order they are mentioned in the prose description. • Avoid zigzagging back and forth across a chart or among rows and columns of a table. • Usually describe a pattern based on observed numeric values, e.g., most to least common. • Often a hypothesis includes some theoretical basis of how items relate to one another.
Ordinal and continuous variables • Values of ordinal, interval, and ratio variables have an inherent numeric order. • E.g., age groups, dates, blood pressure. • Numeric or chronological order of values is the principle for organizing those values in a table or chart.
Nominal variables • Values of nominal variables have no inherent numeric order. • E.g., categories of race, gender, or region. • Need an organizing principle to determine sequence of items. • Same issue if you have more than one variable to present. • Several different causes of death. • Prevalence of each of several symptoms, attitudes, etc.
Prose description of a pattern • A prose description should • Describe size and shape of the pattern. • Explain whether it matches hypothesis. • Specify direction and magnitude of association. • Direction: “Which is higher? • Magnitude: “How much higher?”
Direction for different types of variables • Direction for ordinal, interval, or ratio variable: • Is the relationship positive, negative, or level? • E.g., as income rises, do death rates increase, decrease, or remain constant? • For nominal variables: • Which category of the independent variable has the highest value of the dependent variable? • E.g., which gender has the higher death rate?
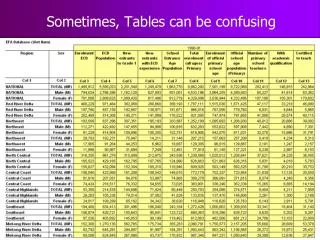
Principles for organizing data • Alphabetical order • Order of items on original data collection instrument • Empirical order • Theoretical groupings • Arbitrary order – NEVER a good idea! • Think about how the data will be used, and choose one of the above principles!
Organizing data in tables and charts to be accompanied by prose:Pattern description or hypothesis testing
Example: Attitudes about legal abortion From the 2000 US General Social Survey
Pattern with a third variable * Difference between men and women is statistically significant at p < 0.05
Identifying theoretical criteria • Consult the published literature on your topic to learn about theoretical criteria for organizing your variables. • In new research areas, empirical sorting may yield clusters with similar response patterns that can then be explored for conceptual overlap.
For self-guided data look up • Why is it important? When is it used? • Researchers look up data for own research questions, then organize the data using empirical or theoretical criteria. • How to organize data for such tasks? • Alphabetical order. • Order of items from data collection instrument. • Standard ordering used in periodic reports.
Alphabetical order • Widely familiar principle, e.g., used in • Phone book • Daily stock market report • Learned at an early age • Facilitates self-guided lookup
Ordering data for a public data source • Order of items on original data collection instrument • Users can refer to codebook • Easy to find the variables they need • Ordering used in periodic reports • Standardized from year to year for a given topic
Summary • There is no one principle for organizing numeric data that fits all possible tasks. • Determine your main objective: • Hypothesis testing or pattern description • Data reporting for others’ use • Choose the organizing principle accordingly.
Suggested resources • Chapters 6 and 7 in Miller, J. E. 2015. The Chicago Guide to Writing about Numbers, 2nd Edition. • Miller, J. E. 2007. “Organizing Data in Tables and Charts: Different Criteria for Different Tasks.” Teaching Statistics29 (3): 98–101. • Podcast on creating effective tables and charts.
Suggested practice exercises • Study guide to The Chicago Guide to Writing about Numbers, 2nd Edition. • Question #4 in the problem set for chapter 6 • Suggested course extensions for • Chapter 6 • “Reviewing” exercise #3 • “Writing and revising” exercises #1–4 • Chapter 7 • “Reviewing” exercise #8 • “Writing and revising” exercises #1 and 2
Contact information Jane E. Miller, PhD jmiller@ifh.rutgers.edu Online materials available at http://press.uchicago.edu/books/miller/numbers/index.html