Download
1 / 48
500 likes | 573 Vues
Enhance your statistical skills with this course covering descriptive and inferential statistics, hypothesis testing, correlation, and regression analysis.

E N D
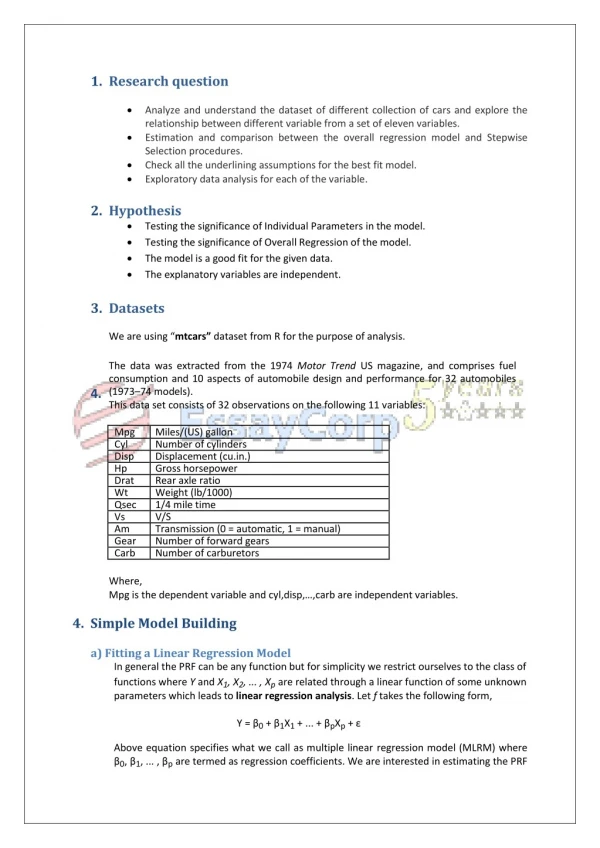
STATISTICS FOR COMMUNICATION RESEARCH ASSOCIATE PROF. DR. JUSANG BOLONG JABATAN KOMUNIKASI 03-8946 8780 jusang@upm.edu.my
OBJEKTIF KURSUS • Padaakhirkursusinipelajardapat: 1. menghuraikonsepstatistikuntukpenyelidikan(C5); 2. mengukurstatistikdeskriptifdanstatistikinferensi (P5); 3. melaksanakanteknikstatistikuntukmenganalisadanmenginterpretasi data (A5, CTPS); 4. merancangdanmenyelaraskerjapenyelidikansecaraberkumpulan(TS, LS)
KANDUNGAN KURSUS • Definisi, jenis dan peranan statistik • Jenis data, tahap pengukuran, sampel dan populasi • Statistik deskriptif dan persembahan data • Indeks kecenderungan memusat dan serakan • Statistik inferensi dan taburan normal
KANDUNGAN KURSUS (Samb.) 6. Ujianhipotesis – jenishipotesis, at, paraskeertian, langkah-langkahujianhipotesisdankeputusan 8. Ujianperbandingan: Ujian T dan ANOVA 9. Ujianperkaitan: Ujian Chi-Square danKorelasi 10. Analisisregrasi: Ujian Multi-regrasi
Penilaian Kursus • KerjaKursus (6 tugasan) 80% • Peperiksaan 20%
Statistics • Scientific methods for collecting, organizing, analyzing data, summarizing, and presenting, as well as with drawing valid conclusions and making reasonable decision on the basis of such analysis. • A branch of applied mathematics that specializes in procedures for describing and reasoning from observations of phenomena
Purpose of Statistics • To describe phenomena, • To organize and summarize our result more conveniently and meaningfully, • To make explain, • To make inference or make certain predictions, and • To make conclusion and suggestion.
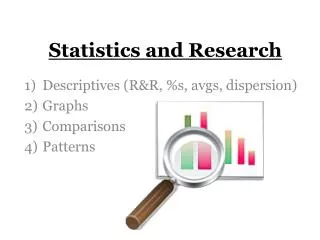
Type of Statistics 1. Descriptive Statistics - Concerned with summarizing the distribution of single variable. (Eg: Frequency distribution, measure of central tendencies, measures of dispersion).
Type of Statistics (cont.) 2. Inferential Statistics - Concerned with making generalization from sample to population. Test of differences and relationship between variables (Eg: T-test, Analysis of Variance and Chi-square, correlation coefficient and deriving regression equation (prediction equation).
Concepts in Statistics Population • The entire group being observed, almost always assumed to be infinite in size • The total collection of all cases in which the researcher is interested and wishes to understanding. • Group or set of human subjects or other entities (Ex: all student at the UPM, all members at Jabatan Komunikasi)
Concepts in Statistics (Cont.) Sample • The sub-group of population • Generalizations based on samples can accurately represent the population
Concepts in Statistics (Cont.) Population • Basic unit of interest • Known as universe • Large in numbers • Difficult to observed • Dynamic Sample • A portion of defined population • Small in numbers • Observable • Can draw inference about population
Concepts in Statistics (Cont.) Variable • As an observable characteristic of an object or event that can be described according to certain classification or scales of measurement • Independent Variable: In bivariate relationship, the variable is taken as cause, normally represented by symbol X
Concepts in Statistics (Cont.) • Dependent variable: In a bivariate relationship, the variable is taken as the effect, normally represented by symbol Y • Continuous variable/data: A variable/data with a unit of measurement that can be subdivided infinitely. Eg: Height = 150.3 cm
Concepts in Statistics (Cont.) Discrete variable/data: A variable with a basic unit of measurement that cannot be subdivided. Eg: sex 1 = Male 2 = Female
Measurement • The process of assigning a number to object, place or person Level of Measurement - The mathematical characteristic of a variable as determined by the measurement process. A major criterion for selecting statistical procedures or techniques.
Level of Measurement (Type of Data) 1. Nominal • Sorting elements with respect to certain characteristics • Sort into categories that are at homogenous as possible • Lowest level of measurement • classification, naming, labeling
Level of Measurement (Type of Data) 2. Ordinal • Grouping or classification of elements with degree of order or ranking • May not be able say exactly how much they possess • Can be arrange or placed in single continuum • Eg: Likert scale
Level of Measurement (Type of Data) 3. Interval • Ordering elements with respect to the degree to which they possess certain characteristics • Indicates the exact distance between them • Zero does not means absence • Eg: 0 degrees Celsius (Suhu rendah)
Level of Measurement (Type of Data) 4. Ratio - Ordering elements with respect to the degree to which they possess certain characteristics • Indicates the exact distance between them • Zero means absence – absolute • Eg: RM0 (tiada pendapatan)
Level of Measurement (Type of Data) • These four scale of measurement can be generalized into two categories: • Non-metric: includes the nominal and ordinal scales of measurement. • Metric: include interval and ratio scales of measurement.
Descriptive Statistics • Frequency distribution • Measure of central tendency • Measure of dispersion
Data Presentation • Basic function of statistics to organize and summarize data: • Frequency table • Graphic presentation - Pie chart - Bar Chart - Histogram - Polygon - Line graph
General guides • Use mode when variable are nominal; you want to present quick and easy measure for ordinal, interval and ratio data/variables. • Use median when variable are ordinal; you want to report the central score and the scores measured at interval and ratio levels have badly skewed distribution
Use mean when variables are interval or ratio (except for badly skewed distribution); you want to report the typical score and you anticipate additional statistical analysis.
Range: The highest score minus the lowest score • Standard Deviation: The square root of the squared deviation of the score around the mean divided by N (number of cases). Represented by the symbol ‘s’ • Variance: The squared deviations of scores around the mean divided by N. Represented by the symbol ‘s²’
Inferential Statistics • To enable researcher to make statement or summary or decision about the population based on the sample • To enable researcher to make statement or summary or decision on the unseen data based on the empirical data • To enable researcher to make statement or summary or decision on the large group based on data from the small group.
Two main procedures of Inferential Statistics • Estimates • Hypothesis Testing
Statistical Assumption • A set of parameters, guidelines indicating the conditions under which the procedures can be most appropriately used. • Every test has own assumption that should not be violated • Four main assumption of Inferential Statistics
Random sample • Characteristics are related to true population • Multiple random sample from same population yield similar statistics that cluster around true population parameters • Can calculate the sampling error associated with a sample statistics
Normal Distribution • The normal probability distribution is a continuous probability distribution (Ref. Equation pg 70) • Data in the normal distribution are measured in terms of standard deviation from mean and are called standard scores or Z score. • Characteristics of Normal Distribution: 1. It is a continuous probability distribution 2. Symmetrical or bell-shaped with the mode, median and mean are equal
3. The distribution contains an infinite number of cases 4. The distribution is asymptotic – the tails approach abscissa: range from negative to positive infinity 5. About 95% of distribution lies within 2 standard deviation from the mean.
Hypothesis Testing • Hypothesis is a tentative statement about something. • Statement concerning: • Differences between groups • Relationship or association between variables
Statement related to our prediction about population characteristics or relationship • Statement related to research question • Statement must be testable or verifiable
Hypothesis statement and testing help us on: • Drawing conclusion • Making implication • Making suggestion
Statistical test is to test the hypothesis • Two types of hypothesis: • Null Hypothesis (Ho) • Alternative or Research Hypothesis (Ha or H1)
Null Hypothesis : A statement of no difference or no association (among variables, samples etc) • Alternative or Research hypothesis: A statement asserting that there is difference or association (among variables, samples, etc)
Two forms of hypothesis: 1. Directional Hypothesis. Eg: Ha: μ >230 or Ha: μ < 230 2. Non-directional Hypothesis. Eg: Ha: μ = 230
FIVE STEP Model for Hypothesis Testing Step 1:making assumption • Samples selected randomly • Defined population • Interval-ratio data • Sampling distribution – normal
Step 2: State the null and research hypothesis Step 3: Selecting the appropriate distribution such as z, t, f and χ² and establishing the level of significance as well as critical region. Step 4: Calculate the test statistics Step 5: State the level of significance and critical region • Level of significance or alpha level commonly used 0.05 • Critical region will determine the rejection or failure to reject the null hypothesis
Step 6: Making decision If test statistic falls in the critical region, reject the null hypothesis. If test statistic does not fall in the critical region, we fail to reject the null hypothesis at predetermined alpha level
Step 7: State the conclusion Type I and Type II Error (Ref: Pg. 86-module) Type I Error (Alpha Error): The probability of rejecting a null hypothesis that is in fact true Type II Error (Beta Error) The probability of failing to reject the null hypothesis in fact false
Level of Significance (Alpha Level) • The probability of area under the sampling distribution that contains unlikely sample outcomes given that the null hypothesis is true. Also, the probability of type I error • Commonly expressed as 90%, 95% or 99% or written as alpha = 0.10, 0.05 or 0.01 • 95%, refers to alpha 0.05 which means that we are 95% sure of making the right decision and 5% error.
Critical Region • The area under the sampling distribution that, in advance of the test itself, is defined as including unlikely sample outcome given that the null hypothesis is true. • Critical value of the test statistic to reject null hypothesis • Critical value is defined from the test statistic table corresponding to its level of significance and degree of freedom.
The null hypothesis is rejected when the value of test statistics exceed the critical value and lies in the critical region
One-tailed and Two-tailed Test • Critical region on one side or both sides of the distribution depending on the nature of alternative or research hypothesis. Eg: Ho: a = b (Two-tailed) Ha: a ≠b Ha: a > b (One-tailed) Ha: a < b
Two-tailed Test • A type of hypothesis test used when direction of difference between variables or samples cannot be predicted (Non-directional hypothesis) • Two-tailed test has a two critical regions on both sides of the distribution
One-tailed Test • A type of hypothesis test used when the direction of the difference between variables or samples can be predicted (Directional hypothesis) • One-tailed test has a one critical region that correspond to the direction of the research hypothesis.