Research Design & Statistics Course: Academic Overview
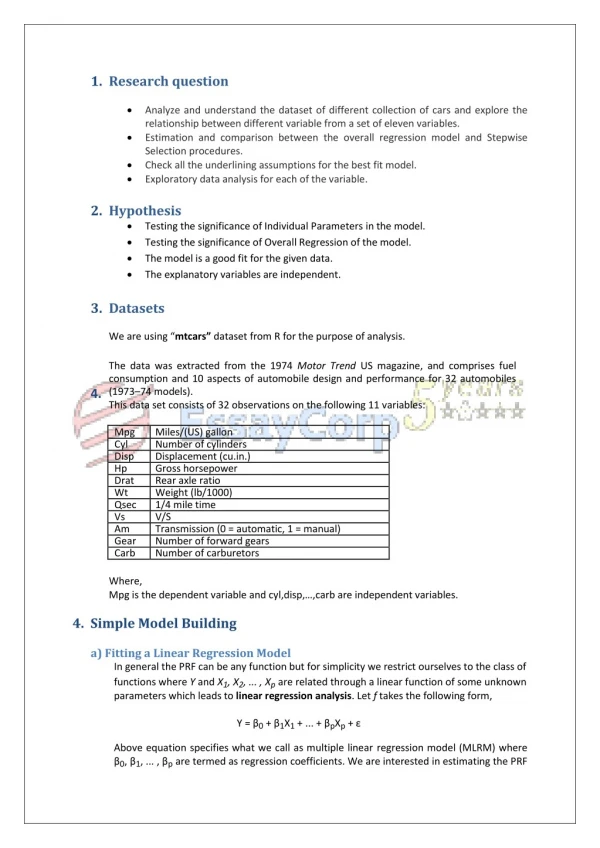
Explore research methodologies, statistical techniques, data analysis, and study design in this comprehensive course. Learn to conceptualize studies, formulate research questions, and interpret results. Course uses Excel and SPSS tools for analysis.


Research Design & Statistics Course: Academic Overview
E N D
Presentation Transcript
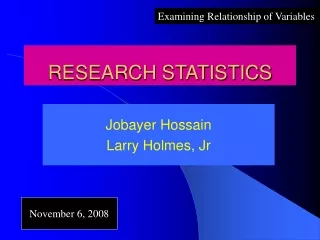
RESEARCH STATISTICS Jobayer Hossain, PhD Larry Holmes, Jr, PhD,DrPH, FACE October 2, 2008
Class Structure • Course Website: http://medsci.udel.edu/open/StatClass/October2008/ • Classes: 8 • Contact Hours: 2 hours • Assignment: • 3 Take-home • To be assigned in week 3, 5, and 6 • Due in week 4, 6,and 8 • 1 Take-home final exam/assignment • Assigned in week 8 -- return for final comments via e-mail.
Class Participation • Default dataset • 60 subjects • 3 or 4 groups • Several measures of different types • (Nominal, Ordinal, Interval, Ratio) • Contributed datasets - (bring your own) • DE-IDENTIFIED! • Areas of special interest • Let us know yours!
Course objectives • At the end of the course participants are expected to: • Understand the basic notion of statistics in research • Know designs used to conduct research • Understand some key elements in research such as- selection of criteria of subjects, variables, measurement scales of variables, and hypothesis • Learn various statistical techniques used to analyze data • Be able to interpret results and draw conclusion • Learn the tools used in the analysis of data – Excel and SPSS
Research Design and Methodology • Research is the process of investigating scientific questions • Steps in Research process- • Defining the problem and conceptualizing the study • Designing and conducting study • Collecting data • Analyzing data • Making sense of data
Defining the problem and conceptualizing the study • Review relevant previous research and identify- • The problem (s) and causes of the problem (s) • State outcomes of previous research on the problem • State clearly what you are planning for the proposed research • Form careful research questions and hypotheses • Identify variables needed to achieve the objective (s)
Defining the problem and conceptualizing the study • Review relevant…identify contd. • Identify scales to measure the variables • Assess the feasibility of study objectives i.e. assess if it is measurable what you want to measure • Identify the target populations and define the eligibility criteria
Research Question • Example - • Does smoking increase the risk of renal carcinoma? • Is oral inhaler effective in controlling asthma among children?
Hypothesis statement • Example - • Smoking increases the risk of renal carcinoma in pediatric patient • Oral inhaler is effective in controlling asthma among children
Study Objective • The purpose or aim of the study • Example- • To assess the risk of renal carcinoma associated with smoking among pediatric patients (primary objective) • To determine the race and gender disparities in the prevalence of smoking (secondary objective)
Study variable • Refers to measurement that changes from one individual to another. • Example- age, gender, BMI, Systolic blood pressure, hematocrit
Outcome vs independent variable • Response/outcome variable: Measures the outcome of the study treatment, or experimental manipulation • Examples- • Renal carcinoma incident among children • Asthma control in pediatric asthmatic patients • Independent/ predictor/explanatory variable: Explains or influences changes in a response variable. • Examples- • Smoking • Oral inhaler
Scale of variable/output measurement • Nominal - Categorical variables without any order or ranking sequence such as names or classes (e.g., gender). Binary- two categories, multinomial- more than two categories. • Ordinal - Variables with an inherent rank or order, e.g. mild, moderate, severe. Can be compared for equality, or greater or less, but not how much greater or less.
Scale of variable/output measurement • Interval - Values of the variable are ordered as in Ordinal, and additionally, differences between values are meaningful, however, the scale is not absolutely anchored. Calendar dates and temperatures on the Fahrenheit scale are examples. Addition and subtraction, but not multiplication and division are meaningful operations. • Ratio - Variables with all properties of Interval plus an absolute, non-arbitrary zero point, e.g. age, weight, temperature (Kelvin). Addition, subtraction, multiplication, and division are all meaningful operations.
Measurement bias • Bias arises due to measurement error • Example- • Suppose, In the case of remission of Asthma, the possible outcomes are complete remission, partial remission and no remission. If we measure the outcome variable as only remission and non-remission, basically we are committing an error by putting partial remission in the non-remission group (type II error).
Designing the study • A study design is a careful advance plan of data collection and the analytic approach needed to answer the research question under investigation in a scientific way. • The basic elements of a study design- • Selecting an appropriate sample size for a specified level of power and level of significance • Selecting methods of sampling, data collection, and analysis appropriate to the study's objectives
Clinical/Experimental versus Observational design The Lancet. 2002, Vol 359
Clinical/Experimental vs Observational design • The choice of a design mainly depends on the research question (s) and type of research conduct ( experimental or observational) • Experimental/ Interventional: The investigatorcontrols the experimental environment in which the hypothesis is tested. The randomized double-blind clinical trial is the gold standard.
Clinical/Experimental vs Observational design • Non-experimental/Observational:The population is observed without any interference by the investigator. • For example, in a study to see the effect of smoking, it is impossible for an investigator to assign smoking to the subjects. Instead, investigator can study the effect by choosing a control group and find the cause and relation effect. Some examples are- • Cross-sectional study • Cohort study • Case-control study
Randomized control design • Random allocation of subjects to different interventions (or treatments) for the purpose of comparing/determining the efficacy of the study treatment (s). • E.g. placebo or standard medication (active control) can be used as a control • Patients with cancer or painful disease can not receive placebo as a control
Randomized control design • Blindness: Reduces the bias due to the preconception or personal bias. • Open trial: Investigator and subject know the full details of the treatment. • Single-blind trial: Investigator knows about the treatment but subject does not. • Double-blind: Both investigator and subject do not know about the treatment • Triple-blind: Sponsor, investigator, and subject do not know about the treatment.
Distribution of a variable Distribution - (of a variable) tells us what values the variable takes and how often it takes these values. E.g. distribution of some 26 pediatric patients of ages 1 to 6 at AIDHC are as follows-
Statistics • Science of data collection, summarization, analysis and interpretation • Descriptive versus Inferential Statistics: • Descriptive Statistic: Data description (summarization) such as center, variability and shape. • Inferential Statistic : Drawing conclusion beyond the sample studied, allowing for prediction.
How does statistics help us? Ages (in month) of the 60 patients in our data set 1 are- 71, 127, 65, 82, 140, 53, 114, 56, 84, 65, 67, 134, 64, …., 91, 51 By simply looking at the data, we fail to produce any informative account to describe the data, how ever, statistics produce a quick insight in to data using graphical and numerical statistical tools
Statistical Description of Data • Statistics describes a numeric set of data by its • Center (mean, median, mode etc) • Variability (standard deviation, range etc) • Shape (skewness, kurtosis etc) • Statistics describes a categorical set of data by • Frequency, percentage or proportion of each category
Statistical Inference • Statistical Inference • Sample Population • Statistical inference is the process by which we acquire information about populations from samples. • Two types of estimates for making inferences: • Point estimation. • Interval estimate.
Population and sample • Population: The entire collection of individuals or measurements about which information is desired. • Sample: A subset of the population selected for study. • Primary objective is to create a subset of population whose center, spread and shape are as close as that of population. • Methods of sampling: Random sampling, stratified sampling, systematic sampling, cluster sampling, multistage sampling, area sampling, qoata sampling etc.
Parameter vs Statistics • Parameter: • Any statistical characteristic of a population. • Population mean, population median, population standard deviation are examples of parameters. • Parameter describes the distribution of a population • Parameters are fixed and usually unknown
Parameter vs Statistics • Statistic: Any statistical characteristic of a sample. • Sample mean, sample median, sample standard deviation are some examples of statistics. • Statistic describes the distribution of population • Value of a statistic is known and is varies for different samples • Are used for making inference on parameter
Parameter vs Statistics • Statistical Issue: To describe the distribution of a population through census or making inference on population distribution/ population parameter using sample distribution/ statistic. • E.g. sample mean is an estimate of the population mean
Hypothesis Testing • Null hypothesis and Alternative hypothesis
Elements/Steps in hypothesis Hypothesis testing steps: 1. Null (Ho) and alternative (H1)hypothesis specification 2. Selection of significance level (alpha) - 0.05 or 0.01 3. Calculating the test statistic –e.g. t, F, Chi-square 4. Calculating the probability value (p-value) or confidence Interval? 5. Describing the result and statistic in an understandable way.
Parameter Population distribution ? Sample distribution Point estimator Point Estimation • A point estimate draws inference about a population by estimating the value of an unknown parameter using a single value or a point.
Parameter Population distribution Sample distribution Interval Estimation • An interval estimator draws inferences about a population by estimating the value of an unknown parameter using an interval. Interval estimator
P-Value versus the Confidence Interval Two main ways to assess study precision and the role of chance in a study. P value measures ( in probability) the evidence against the null hypothesis. An interval within which the value of the parameter lies with a specified probability E.g. 95% CI implies that if one repeats a study 100 times, the true measure of association will lie inside the CI in 95 out of 100 measures
Procedures for sample size calculation • Selection of primary variables of interest and formulation of hypotheses • Information of standard deviation ( if numeric) or proportion (if categorical) • A tolerance level of significance () • Selection of reasonable test statistic • Power or Confidence level • A scientifically or clinically meaning effect/ difference
Brief concept of Statistical Software • There are many software packages to perform statistical analysis and visualization of data. Some of them are- • System for Statistical Analysis (SAS), S-plus, R, Matlab, Minitab, BMDP, STATA, SPSS, StatXact, Statistica, LISREL, JMP, GLIM, HIL, MS Excel etc. We will discuss MS Excel and SPSS in brief . useful websites- http://www.R-project.org (a free but powerful statistical software)
Microsoft Excel A Spreadsheet Application. It features calculation, graphing tools, pivot tables and a macro programming language called VBA (Visual Basic for Applications). There are many versions of MS-Excel. Excel XP, Excel 2003, Excel 2007 are capable of performing a number of statistical analyses. Starting MS Excel: Double click on the Microsoft Excel icon on the desktop or Click on Start --> Programs --> Microsoft Excel. Worksheet: Consists of a multiple grid of cells with numbered rows down the page and alphabetically-tilted columns across the page. Each cell is referenced by its coordinates. For example, A3 is used to refer to the cell in column A and row 3. B10:B20 is used to refer to the range of cells in column B and rows 10 through 20.
Microsoft Excel Opening a document: File Open (From a existing workbook). Change the directory area or drive to look for file in other locations. Creating a new workbook: FileNewBlank Document Saving a File: FileSave Selecting more than one cell: Click on a cell e.g. A1), then hold the Shift key and click on another (e.g. D4) to select cells between and A1 and D4 or Click on a cell and drag the mouse across the desired range. • Creating Formulas: 1. Click the cell that you want to enter the formula, 2. Type = (an equal sign), 3. Click the Function Button, 4. Select the formula you want and step through the on-screen instructions.
Microsoft Excel Entering Date and Time: Dates are stored as MM/DD/YYYY. No need to enter in that format. For example, Excel will recognize Jan 9 or jan-9 as 1/9/2007 and Jan 9, 1999 as 1/9/1999. To enter today’s date, press Ctrl and ; together. Use a or p to indicate am or pm. For example, 8:30 p is interpreted as 8:30 pm. To enter current time, press Ctrl and : together. Copy and Paste all cells in a Sheet: Ctrl+A for selecting, Ctrl +C for copying and Ctrl+V for Pasting. Sorting: Data Sort Sort By … Descriptive Statistics and other Statistical methods: ToolsData Analysis Statistical method. If Data Analysis is not available then click on Tools Add-Ins and then select Analysis ToolPack and Analysis toolPack-Vba
Microsoft Excel Statistical and Mathematical Function: Start with ‘=‘ sign and then select function from function wizard Inserting a Chart: Click on Chart Wizard (or InsertChart), select chart, give, Input data range, Update the Chart options, and Select output range/ Worksheet. Importing Data in Excel: File open FileType Click on File Choose Option ( Delimited/Fixed Width) Choose Options (Tab/ Semicolon/ Comma/ Space/ Other) Finish. Limitations: Excel uses algorithms that are vulnerable to rounding and truncation errors and may produce inaccurate results in extreme cases.
Statistics Packagefor the Social Science (SPSS) A general purpose statistical package SPSS is widely used in the social sciences, particularly in sociology and psychology. SPSS can import data from almost any type of file to generate tabulated reports, plots of distributions and trends, descriptive statistics, and complex statistical analyzes. Starting SPSS: Double Click on SPSS on desktop or ProgramSPSS. Opening a SPSS file: FileOpen MENUS AND TOOLBARS • Data Editor Various pull-down menus appear at the top of the Data Editor window. These pull-down menus are at the heart of using SPSSWIN. The Data Editor menu items (with some of the uses of the menu) are:
Statistics Packagefor the Social Science (SPSS) MENUS AND TOOLBARS FILE used to open and save data files EDIT used to copy and paste data values; used to find data in a file; insert variables and cases; OPTIONS allows the user to set general preferences as well as the setup for the Navigator, Charts, etc. VIEW user can change toolbars; value labels can be seen in cells instead of data values DATA select, sort or weight cases; merge files TRANSFORM Compute new variables, recode variables, etc.
Statistics Packagefor the Social Science (SPSS) MENUS AND TOOLBARS ANALYZE perform various statistical procedures GRAPHS create bar and pie charts, etc UTILITIES add comments to accompany data file (and other, advanced features) ADD-ons these are features not currently installed (advanced statistical procedures) WINDOW switch between data, syntax and navigator windows HELP to access SPSSWIN Help information
Statistics Packagefor the Social Science (SPSS) MENUS AND TOOLBARS Navigator (Output) Menus When statistical procedures are run or charts are created, the output will appear in the Navigator window. The Navigator window contains many of the pull-down menus found in the Data Editor window. Some of the important menus in the Navigator window include: INSERT used to insert page breaks, titles, charts, etc. FORMAT for changing the alignment of a particular portion of the output
Statistics Packagefor the Social Science (SPSS) • Formatting Toolbar When a table has been created by a statistical procedure, the user can edit the table to create a desired look or add/delete information. Beginning with version 14.0, the user has a choice of editing the table in the Output or opening it in a separate Pivot Table (DEFINE!) window. Various pulldown menus are activated when the user double clicks on the table. These include: EDIT undo and redo a pivot, select a table or table body (e.g., to change the font) INSERT used to insert titles, captions and footnotes PIVOT used to perform a pivot of the row and column variables FORMAT various modifications can be made to tables and cells
Statistics Packagefor the Social Science (SPSS) Importing tab-delimited data In SPSSWIN click on FILE ⇒ OPEN ⇒ DATA. Look in the appropriate location for the text file. Then select “Text” from “Files of type”: Click on the file name and then click on “Open.” You will see the Text Import Wizard – step 1 of 6 dialog box. You will now have an SPSS data file containing the former tab-delimited data. You simply need to add variable and value labels and define missing values. Exporting Data to Excel click on FILE ⇒ SAVE AS. Click on the File Name for the file to be exported. For the “Save as Type” select from the pull-down menu Excel (*.xls). You will notice the checkbox for “write variable names to spreadsheet.” Leave this checked as you will want the variable names to be in the first row of each column in the Excel spreadsheet. Finally, click on Save.
Statistics Packagefor the Social Science (SPSS) • Additional menus CHART EDITOR used to edit a graph SYNTAX EDITOR used to edit the text in a syntax window • Show or hide a toolbar Click on VIEW ⇒ TOOLBARS ⇒ to show it/ to hide it • Move a toolbar Click on the toolbar (but not on one of the pushbuttons) and then drag the toolbar to its new location • Customize a toolbar Click on VIEW ⇒ TOOLBARS ⇒ CUSTOMIZE
Statistics Packagefor the Social Science (SPSS) Importing data from an EXCEL spreadsheet: Data from an Excel spreadsheet can be imported into SPSSWIN as follows: 1. In SPSSWIN click on FILE ⇒ OPEN ⇒ DATA. The OPEN DATA FILE Dialog Box will appear. 2. Locate the file of interest: Use the "Look In" pull-down list to identify the folder containing the Excel file of interest 3. From the FILE TYPE pull down menu select EXCEL (*.xls). 4. Click on the file name of interest and click on OPEN or simply double-click on the file name. 5. Keep the box checked that reads "Read variable names from the first row of data". This presumes that the first row of the Excel data file contains variable names in the first row. [If the data resided in a different worksheet in the Excel file, this would need to be entered.] 6. Click on OK. The Excel data file will now appear in the SPSSWIN Data Editor.