Download
1 / 22
220 likes | 245 Vues
Explore concepts such as specific and non-specific binding, compartmental modeling, and drug occupancy in PET imaging. Discuss the relevance of kinetic models and binding potential measurements. Dive into the complexities of receptor occupancy studies and the role of simulations in understanding PET data.

E N D
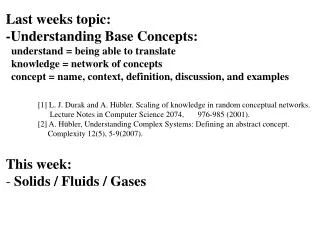
concepts for discussion synopses – don’t overdo it how comfortable were you with Wagner paper, Mintun, Farde? non-specific vs specific binding how to measure non-specific binding (displacement) can we do displacement in humans? maybe… qualitative imaging vs quantitative imaging “tracer” vs “drug” … vs “transmitter” how to create a kinetic (compartmental) model for a PET tracer what is a compartment? what is a mass-balance? Conservation of mass (not conservation of radioactivity; not conservation of concentration…) what do we measure with PET? But what quantity do we need to model? why arterial sampling (need input function) are all parameters estimatable? consider y = m*n*x + b what are simulations good for? binding potential – what does it represent? Binding potential may be an equilibrium measure, but do we need to reach equilibrium to measure it? (how ‘bout your adult height?) drug occupancy – how do we measure it with PET? how did Farde do it? What assumptions did he make? Do you accept them?
Recall from last time…Tracer in each state has a unique temporal trajectory early late which is which ? tracer concentration striatum What the PET scanner sees Bound cerebellum Free Plasma Time (minutes)
why is most of the brain blue? are these “early” or “late” images? is this structural or functional? is this a ‘detection’ or a ‘characterization’ experiment? Fowler et al., Science & Practice Perspectives, April 2007, 4-16
what is the point of excess cold spiperone? what do we learn from it re the caudate? can we compare these numbers across scans? why divide by cerebellum value? could we do this exp’t in a human? ‘late’ or ‘early’ image? whose brain is this? why a CT scan first? why increasing contrast w/ time? why increasing noise w/time? 0.8 1.8 3.4 t (B+F)/F B/F
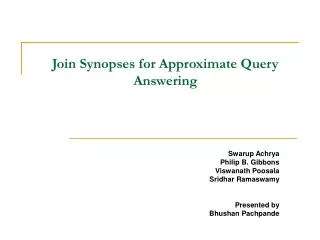
Main points/questions/criticisms – Wagner et al. • so who really did the “first in vivo scan” of DA receptors in a primate? • how did this get into Science (and not Mintun)? • can we assume that cerebellum is exactly the same as the ‘free’ in the striatum? • whose brain was it?
understand this? got equilibrium? • where do error bars come from? • (if so) is the Y axis correct? • where does “specific putamen” come from – special brain area known only in Sweden? where does “expected spec binding” come from? Is this a safe comparison? what factors are ignored? • what is plotted? (B vs F) – how did they get these values? • how did they get 5 data points • what is the slope near origin? • what is the assymptotic value for Y axis?
raclo in cereb (assume = free) --> plug into Bmax*Free/[Kd + Free] using Bmax and Kd from Healthy controls --> predicts B at equilib for schizo patients. Compare to actual B measured for patients (via [striat-cereb] per injected dose – I hope) receptor occup = DB/B (fractional change in binding due to presence of bound drug) = (Bpredicted – Bactual)/Bpredicted first ‘drug occupancy’ study with PET? claim: uniformity of occupancy of D2 by different drugs suggests that occupancy level is related to efficacy.
What’s all this about models in PET? Dopaminergic synapse Plasma raclopride Free raclopride Bound raclopride ‘stuck’ raclopride
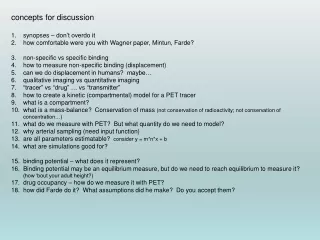
(a) (b) P F B N (c) (d) The modeling process Imagine a living brain Consider the relevant neurochemistry Describe exchange between pools by a series of differential equations Abstract the neurochemistry into a series of connected pools Morris, E.D., C.J. Endres, K. Schmidt, B.T. Christian, R.F. Muzic, R.E. Fisher. Kinetic Modeling in PET. In Emission Tomography: The Fundamentals of PET and SPECT, ed. M. Wernick and N. Aarsvold. Academic Press. Amsterdam, Netherlands, 2004, pp. 499-540.
typically written as… P F B what’s all this about? what is F? conservation of mass Mintun: can’t estimate Bmax and rate constants from high spec act expm’t under what condition? what is the blue? what is the fraction of P that is blue – according to Mintun? according to us?
parameter estimation – what is it? why is it iterative? simulations? what are they good for? what are they used for here? sensitivity analysis – huh? kon*Bmax = Bmax koff KD BP is an equilibrium ratio (has no units of time or rates) but we can get it from a TRANSIENT experiment.
anything tricky about using an in vitro sample for anatomy? what’s the difference between expt 1 and expt 2 in same baboon? why didn’t they estimate BP in 2nd study?
BP = B/F at steady state Schematic Diagram of Ligand Binding “Rest” condition endogenous NT unlabeled tracer radiolabeled tracer
Schematic Diagram of Ligand Binding “Rest” condition loss of receptors BP ↓ endogenous NT unlabeled tracer radiolabeled tracer
Schematic Diagram of Ligand Binding DA-release condition DA ↑ BP ↓ endogenous NT unlabeled tracer radiolabeled tracer
DBP is the (fractional) difference in BP between conditions DBP= (BP1-BP2)/BP1
terms for next week: Sept 20 displacement release endogenous simulation what is Logan proving by her simulations? where they get their parameter vals what things might be causing DA release in Koepp expt? what might have been a better control condition(s)? what do (+) changes in binding potential (Fig 2) mean? what is the ‘proof’ that DA release is being measured? what is being optimized in Morris paper? where do they get their parameter vals?