Download
1 / 38
380 likes | 492 Vues
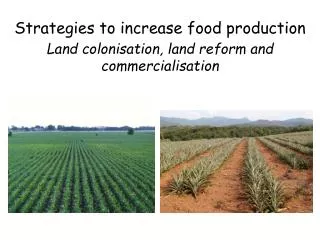
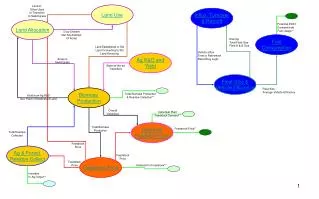
Land in: Other Uses In Transition In Switchgrass. Land Use. Influx, Turnover & Retrofit. Land Allocation. Potential EtOH Demand from Fuel Usage**. Crop Lifetime Net SG Addition Of Acres. Fuel Consumption. Retiring Total Fleet Size Fleet A & B Size. Land Established in SG

E N D
Land in: Other Uses In Transition In Switchgrass Land Use Influx, Turnover & Retrofit Land Allocation Potential EtOH Demand from Fuel Usage** Crop Lifetime Net SG Addition Of Acres Fuel Consumption Retiring Total Fleet Size Fleet A & B Size Land Established in SG Land Converting to SG Land Reverting Vehicle Influx Time to Retirement Retrofitting Logic Ag R&D and Yield Acres in Switchgrass State-of-the-art Yield/Acre Fleet Size & Vehicle Efficiency Fleet Size Average Vehicle Efficiency Biomass Production Total Biomass Production & Residue Collection** Yield from Ag R&D Ave Yield in Established Land Overall Yield/Acre Individual Plant Feedstock Demand** Delivered Feedstock Cost Total Biomass Production Feedstock Price** Total Residue Collected Feedstock Price Ag & Forest Residue Collect Feedstock Price Feedstock Price Feedstock Price Demand for Feedstock** Increase In Ag Output**
Agricultural & Forest Residue Collection Feedstock Price Calculates the total Agricultural and Forest Residues available at different feedstock prices Total Biomass Production Maximum Ag Yield Improvement = 25% Ag Residue Linear Annual Growth Rate = 1% Ag & Forest Residue Collection – 1
Agricultural & Forest Residue Collection Calculates the total Agricultural and Forest Residues available at different feedstock prices Feedstock Price Ag & Forest Residue Collection – 2 Total Biomass Production Forest Residue Availability is fixed and is only a function of offer price Maximum Ag Yield Improvement = 25% Ag Residue Linear Annual Growth Rate = 1% Forest Residue Collected (MM ton/yr) Feedstock Price
Agricultural & Forest Residue Collection Calculates the total Agricultural and Forest Residues available at different feedstock prices Feedstock Price Total Biomass Production Forest Residue Availability is fixed and is only a function of offer price Ag Residue Availability is a function of offer price with 1% linear growth rate up to 25% growth from the 2005 quantity. Maximum Ag Yield Improvement = 25% Ag Residue Linear Annual Growth Rate = 1% Forest Residue Collected (MM ton/yr) Ag Residue Collected (MM ton/yr) Ag & Forest Residue Collection – 3 Feedstock Price Feedstock Price
Actual STELLA Module Flowsheet Agricultural & Forest Residue Collection Ag & Forest Residue Collection – 4
Land Use Switchgrass Maturation Time Calculates the amount of land that is being used for switchgrass production (acres) Land Established in SG Land Converting to SG Land Reverting Crop Lifetime Net SG Addition of Acres • Two land types: • Prime • Marginal Land in: Other Uses In Transition In Switchgrass Land Use - 5
Land Use Land Use - 6 Switchgrass Maturation Time Calculates the amount of land that is being used for switchgrass production (acres) Land Established in SG Land Converting to SG Land Reverting Crop Lifetime Net SG Addition of Acres Crop Lifetime is calculated as a function of the economics of switchgrass compared to non-switchgrass land use as well as current switchgrass yields Land in: Other Uses In Transition In Switchgrass Impact of SG economics on Lifetime Revenue ($/acre) ratio for established land
Land Use Switchgrass Maturation Time Calculates the amount of land that is being used for switchgrass production (acres) Land Established in SG Land Converting to SG Land Reverting Crop Lifetime Net SG Addition of Acres Addition of SG acres is also a function of the net revenue for switchgrass vs. other uses. Land in: Other Uses In Transition In Switchgrass Land Use - 7
Nominal SG Crop Lifetime SG Maturation Time Export Scenario Constant SG Yield Option Land Allocation Crop Lifetime Net addition of Switchgrass • The outcomes from this module are: • Whether to plant land in switchgrass or other uses. • Calculates the crop lifetime. • Total Acres in Switchgrass Acres in Switchgrass Feedstock Price Switchgrass Production (MM Acres) Switchgrass Yield (ton/acre) The land owner decides whether to plant acres in switchgrass or other uses depending on the revenue earned per acre per crop. $/acre Switchgrass vs. $/acre in other uses Land Allocation -1
Nominal SG Crop Lifetime SG Maturation Time Constant SG Yield Option Land Allocation Land Allocation -2 Crop Lifetime Net addition of Switchgrass • The outcomes from this module are: • Whether to plant land in switchgrass or other uses. • Calculates the crop lifetime. • Total Acres in Switchgrass Acres in Switchgrass Feedstock Price Switchgrass Production (MM Acres) Switchgrass Yield (ton/acre) The expected revenue for land in switchgrass is a product of the payment to the farmer ($/ton) and the yield (tons/acre)
Nominal SG Crop Lifetime SG Maturation Time Constant SG Yield Option Land Allocation Crop Lifetime Net addition of Switchgrass • The outcomes from this module are: • Whether to plant land in switchgrass or other uses. • Calculates the crop lifetime. • Total Acres in Switchgrass Acres in Switchgrass Feedstock Price Switchgrass Production (MM Acres) Switchgrass Yield (ton/acre) The value of land in other uses is a function of the demand for product. More land in switchgrass will drive the price for product from land in other uses higher due to land constraint issues. Land Allocation -3
Actual STELLA Module Flowsheet Land Allocation Land Allocation -4
Agricultural R&D and Yield The Yield from R&D is a function of the Investment made into the R&D program. Ag R&D Investment (MM$/yr) Switchgrass Yield from R&D R&D Yield Growth is analogous to historical corn yields; exponential for a time period, then slowing to a linear growth rate BSM has a maximum effective Ag R&D of 10-MM$/yr. Any amount over that will have no effect on R&D yields. Fraction of Max YPA growth Obtained Ag R&D Investment (MM$/yr) Ag R&D and Yield – 5 Year Ag Investment relative to Max
Agricultural R&D and Yield Ag R&D and Yield – 6
Biomass Production Biomass Production Ag & Forest Production Calculates the total Biomass Production for Ethanol Switchgrass Land Dynamics Switchgrass Yield (ton/acre) Total Switchgrass Acres Calculates the overall switchgrass yield (ton/acre) Biomass Production to Industrial Capacity Module Switchgrass Yield (ton/acre) Biomass Production - 7
Biomass Production Biomass Production Ag & Forest Production Biomass Production - 8 Calculates the total Biomass Production for Ethanol Switchgrass Yield (ton/acre) Switchgrass Land Dynamics Total Switchgrass Acres Calculates the overall switchgrass yield (ton/acre) Biomass Production to Industrial Capacity Switchgrass Yield (ton/acre) The total switchgrass production (volume basis) is the sum of the production from land in transition to switchgrass + the production from land established in switchgrass. Production from land in transition is defined as the product of acreage converting to SG and the yield based on ‘state of the art’ Ag research. Production from established land is defined as the product of mature SG acreage and the yield based on actual SG production.
Biomass Production Biomass Production Ag & Forest Production Calculates the total Biomass Production for Ethanol Switchgrass Land Dynamics Switchgrass Yield (ton/acre) Total Switchgrass Acres Calculates the overall switchgrass yield (ton/acre) Biomass Production to Industrial Capacity and Tracking Government Spending Modules Switchgrass Yield (ton/acre) The overall YPA is the total tonnage produced annually divided by the total acreage in switchgrass. Biomass Production - 9
Actual STELLA Module Flowsheet Biomass Production Biomass Production - 10
Feedstock Price Number of Plants On-Line • Feedstock Price is Adjusted based on: • Ratio of Max Feedstock Supply to Demand • Ratio of Spot Inventory to Actual Demand • Responsiveness of Price to Change (Gain) Feedstock Demand Feedstock Supply Feedstock Price Price Response to change (“gain”) Max Mature Yield Constant Feedstock Price Option Initial Feedstock Price = $20/bdt Feedstock Price -1
Feedstock Price Number of Plants On-Line Feedstock Price -2 Feedstock Demand Determine an impact on the Feedstock Price due to the ratio: Where Max Feedstock Demand is the sum of the capacity of all plants under const, starting up or online Feedstock Supply Feedstock Production Max Feedstock Demand Feedstock Price Price Response to change (“gain”) Max Mature Yield Constant Feedstock Price Option Fractional Change in Feedstock Price Initial Feedstock Price = $20/bdt Feedstock Production Max Feedstock Demand
Feedstock Price Number of Plants On-Line Determine an impact on the Feedstock Price due to the ratio: Where, Spot Inventory is the difference in actual demand and production Actual demand is the operating capacity (actual yield) of online plants Feedstock Demand Spot Inventory Actual Feedstock Demand Feedstock Supply Feedstock Price Price Response to change (“gain”) Max Mature Yield Constant Feedstock Price Option Fractional Change in Feedstock Price Initial Feedstock Price = $20/bdt Feedstock Price -3 Spot Inventory Actual Feedstock Demand
Feedstock Price Number of Plants On-Line Feedstock Price -4 Calculate the Change in Feedstock Price as: Feedstock Demand Change in Feedstock Price = Old Feedstock Price x Spot Inventory Ratio Factor x Max Demand Ratio Factor x Price Response to Change (0 to 2) Feedstock Supply Feedstock Price Price Response to change (“gain”) Max Mature Yield Constant Feedstock Price Option Initial Feedstock Price = $20/bdt
Actual STELLA Module Flowsheet Feedstock Price Feedstock Price -5
Delivered Feedstock Cost Feedstock Price Individual plant feedstock capacity • This module calculates the cost for feedstock at the plant gate. • The plant gate feedstock cost is the largest operating cost for a conversion facility • The minimum ethanol selling price (MESP) calculated from this cost is compared to gasoline and dry mill selling prices Feedstock Cost Yield (ton/acre) Feedstock subsidy for Farmer Fraction of SG in Surrounding land to plant Free Captive Feedstock Option Free Feedstock Option for Demo & Pioneer • The delivered feedstock cost is calculated in three sections: • Feedstock Quantity in area of plant (distance from the plant) • Calculating the transportation charge and any options, and • Adding the feedstock price and including any subsidy for the grower Delivered Feedstock Cost -6
Delivered Feedstock Cost Feedstock Price Individual plant feedstock capacity This module calculates the cost for feedstock at the plant gate. Delivered Feedstock Cost -7 Feedstock Cost The distance from the feedstock to the plant gate is calculated by using the equation below; Where the plant size is in the numerator and the denominator consists of the yield and the fraction of the feedstock in the surrounding area of the plant. Yield (ton/acre) Feedstock subsidy for Farmer Fraction of SG in Surrounding land to plant Free Captive Feedstock Option Free Feedstock Option for Demo & Pioneer
Delivered Feedstock Cost Feedstock Price Individual plant feedstock capacity This module calculates the cost for feedstock at the plant gate. Feedstock Cost Yield (ton/acre) Transport Cost = ($/ton-mile * Winding Factor * Miles to Plant) + Fixed Transport $/ton Feedstock subsidy for Farmer Fraction of SG in Surrounding land to plant Free Captive Feedstock Option Free Feedstock Option for Demo & Pioneer The user has an option to allow feedstock quantities under 200,000 ton/yr to be free for a demo plant. This quantity is assumed to be the fiber that comes along with the corn and is already accounted for in the price of the delivered corn Delivered Feedstock Cost -8
Delivered Feedstock Cost Feedstock Price Individual plant feedstock capacity This module calculates the cost for feedstock at the plant gate. Delivered Feedstock Cost -9 Feedstock Cost The delivered feedstock cost = Transportation cost + The cost to the grower – User inputted feedstock subsidy Yield (ton/acre) Feedstock subsidy for Farmer Fraction of SG in Surrounding land to plant Free Captive Feedstock Option Free Feedstock Option for Demo & Pioneer The user has the option to make feedstock quantities for demo and pioneer plants (< 2-million tons/yr) free for the plant operator
Actual STELLA Module Flowsheet Delivered Feedstock Cost Delivered Feedstock Cost -10
Influx, Turnover and Retrofit Logic Vehicle Influx Logic Time to Retirement Retrofitting Logic Retiring Total Fleet Size Fleet A & B size • This module calculates • The influx of new vehicles, • The time to retirement, and • The retrofitting of fleet vehicles • Each vehicle type is separated into three sub-fleets based on vehicle age. • The time in each sub-fleet is 1/3 of each vehicle type’s lifetime (time to retirement). Fleet Growth Rate (%) New Vehicle Distribution Average miles/yr per vehicle Average Miles to Retirement Accelerated Vehicle Turnover Fraction of Fleet retrofitted/yr User has option to choose between ‘Baseline’ and Union of Concerned Scientists (UCS) Fleet Assumptions Influx, Turnover and Retrofit -1
Influx, Turnover and Retrofit Logic Vehicle Influx Logic Time to Retirement Retrofitting Logic Retiring Total Fleet Size Fleet A & B size • This module calculates • The influx of new vehicles, • The time to retirement, and • The retrofitting of fleet vehicles Influx, Turnover and Retrofit -2 New Vehicle Influx Vehicle Influx Logic = total Vehicle influx * influx distribution [Type] Total Vehicle Influx = influx for fleet growth + influx to replace retirement Influx for Fleet Growth = Total Fleet * Fleet Growth Rate (%) Fleet Growth Rate (%) New Vehicle Distribution Average miles/yr per vehicle Average Miles to Retirement Accelerated Vehicle Turnover Fraction of Fleet retrofitted/yr
Influx, Turnover and Retrofit Logic Vehicle Influx Logic Time to Retirement Retrofitting Logic Retiring Total Fleet Size Fleet A & B size • This module calculates • The influx of new vehicles, • The time to retirement, and • The retrofitting of fleet vehicles Vehicle Turnover The time to retirement for vehicles = average miles to retirement average miles per vehicle per year. Fleet Growth Rate (%) New Vehicle Distribution Average miles/yr per vehicle Average Miles to Retirement Accelerated Vehicle Turnover Fraction of Fleet retrofitted/yr There is an option to double the turnover rate, thereby reducing the time to retirement by a factor of two. Influx, Turnover and Retrofit -3
Influx, Turnover and Retrofit Logic Vehicle Influx Logic Time to Retirement Retrofitting Logic Retiring Total Fleet Size Fleet A & B size • This module calculates • The influx of new vehicles, • The time to retirement, and • The retrofitting of fleet vehicles Influx, Turnover and Retrofit -4 Vehicle Retrofitting Retrofitting is the act of modifying conventional gasoline vehicles to become a flex-fuel vehicles The fraction of fleet vehicles retrofitted per year drives this module. Fleet Growth Rate (%) New Vehicle Distribution Average miles/yr per vehicle Average Miles to Retirement Accelerated Vehicle Turnover Fraction of Fleet retrofitted/yr Vehicle in Fleets A & B can be retrofitted
Actual STELLA Module Flowsheet Influx, Turnover and Retrofit Logic Influx, Turnover and Retrofit -5
Fleet Size and Vehicle Efficiency Tracking Retiring Total Fleet Size Fleet A & B size Vehicle Influx Logic Time to Retirement Retrofitting Logic This module tracks the number of vehicles and the efficiency of vehicles of each fuel type. There is a complimentary module to calculate the total fleet and both the average and aggregate efficiency of each vehicle type Fleet Size Average Vehicle Efficiency (mpg) Efficiency of incoming vehicles (mpg) Fleet Volumes Fleet Efficiencies Fleet Size & Vehicle Efficiency -6
Fleet Size and Vehicle Efficiency Tracking Fleet Size & Vehicle Efficiency -7
Fuel Consumption Logic To: Plant Addition Logic Module Fleet Size Average Vehicle Efficiency (mpg) • This module calculates the potential ethanol demand for total, E85 and E10 vehicles • The total demand is compared to the total current production in the Plant Addition Logic module to measure the attractiveness for investors to build additional plants • There are also calculations for E85 and E10 potential Maximum Potential EtOH Consumption (MM-gal/yr) Average miles/yr per vehicle Fuel Consumption -8
Fuel Consumption Logic Fuel Consumption -9 Fleet Size Average Vehicle Efficiency (mpg) • This module calculates the potential ethanol demand for total, E85 and E10 vehicles • The total demand is compared to the total current production in the Plant Addition Logic module to measure the attractiveness for investors to build additional plants Maximum Potential EtOH Consumption (MM-gal/yr) Average miles/yr per vehicle The module on the right calculates the fraction of the E85 and E10 markets filled by actual ethanol production.
Actual STELLA Module Flowsheet Fuel Consumption Logic Fuel Consumption -10