Download
1 / 15
150 likes | 283 Vues
This resource covers essential concepts about options trading, focusing on call and put options, their roles in futures contracts, and hedging strategies. It explains the rights associated with buying options, how to leverage them for protection against price declines, and the distinct characteristics of calls and puts. Additionally, it offers insights into contract expiration and important market mechanics on CBOT and CME platforms. Review session information and related reading materials, including insights from Purcell & Koontz, are also included.

E N D
Agec 420 HW #7: Chart - due today HW #8: Regression – Fri. May 3 HW #9: Options in TradeSim Monday 29th – David Frey, Kansas Wheat Commission Exam 3: Friday, May 3 - review session?? Options – cont. Position diagrams
Markets • CBOT: http://www.cbot.com/ • CME: http://www.cme.com/
Options - review Call option: • right to buy the underlying futures contract • at the specified strike price Put option: • right to sell the futures at the strike price Reading Purcell & Koontz – Ch 7 CBOT Publication – on web page
Options – Notes • Calls and puts are separate contracts – not opposite sides of the same transaction • Options usually expire before the futures delivery month begins
Contract Expiration • Futures • no trades in the last 7 business days of the delivery month • 1st delivery day - 1st business day of delivery month • Options • expire 5 business days before delivery begins
Hedging with Put Options • Short Hedger • Wants protection from a price decline • Take a position in futures/options that will make $ if prices decline • Buy a put option • If price fall – put becomes more valuable - position makes $ • If prices rise – put expires worthless • Price is not locked-in (upside potential remains – but at a cost)
Hedging with Put Options - like buying insurance • Pay a premium to protect against possible loss • Once premium is paid – no further obligation • If price fall – you’re covered • (because the put option becomes more valuable) • If price rises – forget about it!
Sample Option Prices • Dec corn – • www.cbot.com • To illustrate • Put-call parity • Time value
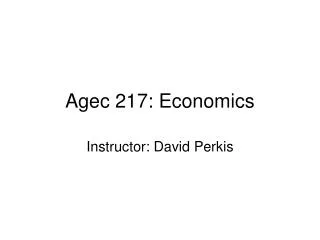
Position Diagram • shows how net realized price (profit) changes as the futures price changes Vertical axis: net realized price (profit) Horizontal axis: futures price
Long Cash Net Price 2.80 2.20 2.50 2.80 Futures Price 2.50 2.20
Short Futures @ 2.50 Net Profit +30 +20 +10 2.20 2.50 2.80 Futures Price 0 -10 -20 -30
Long Cash + Short Futures @ 2.50 Futures 2.80 Cash Net Price 2.70 2.60 2.50 2.20 2.80 Hedge 2.50 2.40 2.30 2.20