Technical Analysis and Chart Patterns Guide for Markets
140 likes | 250 Vues
Learn about chart patterns, moving averages, market trends, reversal patterns, and technical vocabulary. Understand how to use RSI, moving averages, and other technical systems for market analysis. Resources from CBOT and CME included.

Technical Analysis and Chart Patterns Guide for Markets
E N D
Presentation Transcript
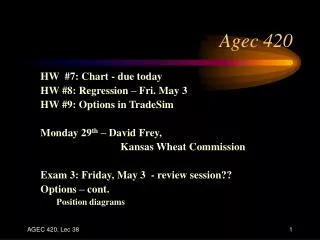
Agec 420 • Homework #7 • Charting • Review Quiz 7
Markets • CBOT: http://www.cbot.com/ • CME: http://www.cme.com/
Readings on Technical Analysis Purcell: Chapter 4 on the Bar Chart describes many chart patterns, their “reliability” Chapter 5: section on moving averages Malkiel: Chapters 5 and 6 disputes the claim of “reliability”
Charts Trends and reversals Tops, bottoms, (Head & Shoulders) Other reversal patterns • Key, Hook, Island reversals • See Purcell text for others: • Consolidation patterns – flags, pennants • Gaps and Corrections
Technical Vocabulary “The market’s rise after a period of reaccumulation is a bullish sign. Nevertheless, fulcrum characteristics are not net clearly present and a resistance area exists 40 points higher in the Dow, so it is clearly premature to say the next leg of the bull market is up. If, in the coming weeks, a test of the lows holds and the market breaks out of its flag, a further rise would be indicated. Should the lows be violated, a
cont. continuation of the intermediate term downtrend is called for. In view of the current situation, it is a distinct possibility that traders will sit in the wings awaiting a clearer delineation of the trend and the market will move in a narrow trading range.”
Final thought … • If a well known buy signal is “reliable” ---- who would sell? • Same argument applies to fundamental analysis !!
Indices and Moving Averages Purcell: Chapter 4: RSI Chapter 5: Section on moving averages
Relative Strength Index (RSI) • measures market “momentum” • based on price changes in the previous 14 days • Signals whether market is “overbought” or “oversold”
Calculating RSI • record the last 14 price changes • calculate D • sum the negative changes, divide by 14 • calculate U • sum the positives, divide by 14 • RSI = U/U+D (%) see Purcell, Ch. 4
Using RSI • RSI > 70% • “overbought” market • all traders who want to buy are in • market running out of momentum • price decline imminent --> prepare to sell • RSI < 30% • signals an oversold market • a buy signal
Moving Averages • to monitor trends • 3-day moving average • add the last 3 closing prices; divide by 3 • by construction, behaves more smoothly than the daily price • reveals the trend • See Purcell, Ch 5
Using Moving Averages • use 2 moving averages • long (e.g. 18 day) --> reveals trend • short (e.g. 9 day) --> reveals change in trend • get signals when lines cross • short crosses long moving up --> buy • short crosses long moving down --> sell
Other technical systems • Stochastic oscillators (%k and %d) • Elliot wave theory • Bollinger bands • Andrew’s pitchfork • Zig Zag indicator See www.equis.com/free/taaz/