Download
1 / 66
660 likes | 863 Vues
Probability & Statistical Inference Lecture 3. MSc in Computing (Data Analytics). Lecture Outline. A quick recap Solutions to last weeks question Continuous distributions. A Quick Recap. Probability & Statistics.

E N D
Probability & Statistical Inference Lecture 3 MSc in Computing (Data Analytics)
Lecture Outline • A quick recap • Solutions to last weeks question • Continuous distributions.
Probability & Statistics • We want to make decisions based on evidence from a sample i.e. extrapolate from sample evidence to a general population • To make such decisions we need to be able to quantify our (un)certainty about how good or bad our sample information is. MakeInference Describe
Some Definitions • An experiment that can result in different outcomes, even though it is repeated in the same manner every time, is called a random experiment. • The set of all possible outcomes of a random experiment is called the sample space of an experiment and is denote by S • A sample space is discrete if it consists of a finite or countable infinite set if outcomes. • A sample space is continuous if it contains an interval or real numbers. • An event is a subset of the sample space of a random experiment.
Some Definitions • A sample space is discrete if it consists of a finite or countable infinite set if outcomes. • A sample space is continuous if it contains an interval or real numbers. • An event is a subset of the sample space of a random experiment.
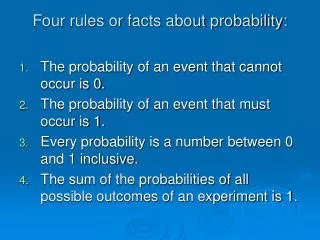
Probability • Whenever a sample space consists of n possible outcomes that are equally likely, the probability of the outcome 1/n. • For a discrete sample space, the probability of an event E, denoted by P(E), equals the sum of the probabilities of the outcome in E. • Some rules for probabilities: • For a given sample space containing n events E1, E2, E3, ........,En • All simple event probabilities must lie between 0 and 1: 0 <= P(Ei) <= 1 for i=1,2,........,n • The sum of the probabilities of all the simple events within a sample space must be equal to 1:
Discrete Random Variable • A Random Variable (RV) is obtained by assigning a numerical value to each outcome of a particular experiment. • Probability Distribution: A table or formula that specifies the probability of each possible value for the Discrete Random Variable (DRV) • DRV: a RV that takes a whole number value only
Summary Continued… • For Discrete RV we often have a mathematical formula which is used to calculate probabilities, i.e. P(x) = some formula • This formula is called the Probability Mass Function (PMF) • Given the PMF you can calculate the mean and variance by: • When the summation is over all possible values of x
Binomial Distribution – General Formula • This all leads to a very general rule for calculating binomial probabilities: In General Binomial (n,p) n = no. of trials p = probability of a success x = RV (no. of successes) • Where P(X=x) is read as the probability of seeing x successes.
Binomial Distribution • If X is a binomial random variable with the paramerters p and n then
Poisson Probability Distribution • Probability Distribution for Poisson Where is the known mean: • x is the value of the RV with possible values 0,1,2,3,…. e = irrational constant (like ) with value 2.71828… • The standard deviation , , is given by the simple relationship; • =
Questions • A factory has two assembly lines, each of which is shut down (S), at partial capacity (P), or at full capacity (F). The following table gives the sample space For where (S,P) denotes that the first assembly line is shut down and the second one is operating at partial capacity. What is the probability that: • Both assembly lines are shut down? • Neither assembly lines are shut down • At least one assembly line is on full capacity • Exactly one assembly line is at full capacity
Answer A • A factory has two assembly lines, each of which is shut down (S), at partial capacity (P), or at full capacity (F). The following table gives the sample space a) What is the probability both assembly lines are shut down = 0.02
Answer B • A factory has two assembly lines, each of which is shut down (S), at partial capacity (P), or at full capacity (F). The following table gives the sample space b) What is the probability that neither assembly lines are shut down = 0.14 + 0.21 + 0.2 + 0.19 = 0.74
Answer C • A factory has two assembly lines, each of which is shut down (S), at partial capacity (P), or at full capacity (F). The following table gives the sample space c) What is the probability at least one assembly line is on full capacity = 0.06 + 0.21 + 0.05 + 0.2 + 0.19 = 0.71
Answer D • A factory has two assembly lines, each of which is shut down (S), at partial capacity (P), or at full capacity (F). The following table gives the sample space d) What is the probability exactly one assembly line is at full capacity = 0.06 + 0.21 + 0.05 + 0.2 = 0.52
Exercise: There is more that one way to skin a cat! • If two fair die are thrown what is the probability that at least one score is a prime number (2, 3, 5)? • What is the compliment of the event? • What is its probability? There are three ways (at least) that we can approach this problem
Solution 1: Brute Force Approach • Enumerate the sample space and select those outcomes that satisfy the desired conditions • 36 possible combinations of 2 die
Solution 1: Brute Force Approach • Enumerate the sample space and select those outcomes that satisfy the desired conditions • 36 possible combinations of 2 die • 27 combinations include a prime number
Solution 1: Brute Force Approach • Enumerate the sample space and select those outcomes that satisfy the desired conditions • 36 possible combinations of 2 die • 27 combinations include a prime number • Probability of at least one prime is 27/36 = 0.75
Solution 1: The Compliment • What is the compliment of the event? • That neither score is a prime number (2, 3, 5) when two fair dice are thrown • What is its probability? • Let the event be E and its probability be P(E) • Then the compliment of E is E’ and the probability of E`, P(E`), is equal to 1 – P(E) • In our case P(E) = 0.75 => P(E`) = 1 – 0.75 = 0.25
Solution 2: Find the Probability of the Compliment • To start let’s work out, if we throw a single dice what is the probability of not getting a prime number?
Solution 2: Find the Probability of the Compliment • The brute force approach is fine for two dice, but cumbersome as the number of dice increases – i.e. 3 dice, 4 dice…..12 dice….1,247 dice! • Our question can be slightly rearranged to reveal a possible solution • If two fair die are thrown what is the probability that at least one score is a prime number (2, 3, 5)?
Solution 2: Find the Probability of the Compliment • The brute force approach is fine for two dice, but cumbersome as the number of dice increases – i.e. 3 dice, 4 dice…..12 dice….1,247 dice! • Our question can be slightly rearranged to reveal a possible solution • If two fair die are thrownwhat is the probability that at least one score is a prime number(2, 3, 5)?
Solution 2: Find the Probability of the Compliment • The brute force approach is fine for two dice, but cumbersome as the number of dice increases – i.e. 3 dice, 4 dice…..12 dice….1,247 dice! • Our question can be slightly rearranged to reveal a possible solution • If two fair die are thrownwhat is the probability that at least one score is a prime number(2, 3, 5)? • What is the probability of one or more primes from two dice throws?
Solution 2: Find the Probability of the Compliment • The brute force approach is fine for two dice, but cumbersome as the number of dice increases – i.e. 3 dice, 4 dice…..12 dice….1,247 dice! • Our question can be slightly rearranged to reveal a possible solution • If two fair die are thrownwhat is the probability that at least one score is a prime number(2, 3, 5)? • What is the probability of one or more primes from two dice throws? • What is the probability of one or more of outcome O from X trials?
Solution 2: Find the Probability of the Compliment • The brute force approach is fine for two dice, but cumbersome as the number of dice increases – i.e. 3 dice, 4 dice…..12 dice….1,247 dice! • Our question can be slightly rearranged to reveal a possible solution • If two fair die are thrownwhat is the probability that at least one score is a prime number(2, 3, 5)? • What is the probability of one or more primes from two dice throws? • What is the probability of one or more of outcome O from X trials? • If questions are of this form we can work out the answer by working out the compliment first
Solution 2: Find the Probability of the Compliment • What is the probability that neither score is a prime number (2, 3, 5) when two fair dice are thrown? • This is an easier probability to calculate as we can consider throwing each dice as an independent event and combine the probabilities that neither results in a prime • It is the “one or more” in the previous problem that makes things tricky as we cannot consider each dice throw as an independent event
Solution 2: Find the Probability of the Compliment • To start let’s work out, if we throw a single dice what is the probability of not getting a prime number? • Sample space: {1, 2, 3, 4, 5, 6} • Primes: {2, 3, 5} • Non-primes: {1, 4, 6} • So, probability is 3/6
Solution 2: Find the Probability of the Compliment • If the probability of getting no prime if we throw one dice is 3/6, what is the probability of getting no primes if we throw two dice in a row?
Solution 2: Find the Probability of the Compliment • If the probability of getting no prime if we throw one dice is 3/6, what is the probability of getting no primes if we throw two dice in a row? • Dice rolls are independent events • Remember our intersection rule for independent events • So, the probability of getting no primes if we throw two dice in a row is:
Solution 2: Find the Probability of the Compliment • Our event, E, was that neither score is a prime number (2, 3, 5) when two fair dice are thrown • So the complement of this event, E`, is that at least one score is a prime number (2, 3, 5) when two fair dice are thrown • We know that given the probability of event E, P(E), we can work our the probability of the complement of this event, P(E`), as 1 – P(E) • So for our dice example
Solution 2: Find the Probability of the Compliment • The great thing is that this works for any number of dice • The probability, P(E), of getting no primes if we throw n dice in a row is: • So, for three dice the probability of getting no primes is • This means that the probability of getting at least one prime from 3 dice rolls is 1 – 1/8 = 7/8
Solution 3: Use the Binomial Distribution • Problems that can be stated as: • what is the probability of seeing xsuccesses in nindependent binary trials • can be solved using the Binomial distribution. • For example: • what is the probability of seeing 1 prime in 2dice throws
Solution 3: Use the Binomial Distribution • The Binomial probability, P(X=x), (read as the probability of seeing x successes) is given by: • where n is the number of trials, p is the probability of a success and , known as a combination, is the number of ways of getting x successes from n trials
Solution 3: Use the Binomial Distribution • So, what is the probability of seeing 1 prime in 2dice throws • n = 2 p = 1/2 x = 1
Solution 3: Use the Binomial Distribution • Exercise: What is the probability of seeing 2 primes in 2dice throws
Solution 3: Use the Binomial Distribution • Exercise: What is the probability of seeing 2 primes in 2dice throws
Solution 3: Use the Binomial Distribution • So, what is the probability of seeing one or more primes in 2dice throws? • P(1 ≤ X ≤ 2) = P(X = 1) + P(X = 2) = ½ + ¼ = ¾ • More generally then we can say that the probability of seeing one or more primes in ndice throws is:
Continuous Probability Distributions • Experiments can lead to continuous responses i.e. values that do not have to be whole numbers. For example: height could be 1.54 meters etc. • In such cases the sample space is best viewed as a histogram of responses. • The Shape of the histogram of such responses tells us what continuous distribution is appropriate – there are many.
Normal Distribution (AKA Gaussian) • The Histogram below is symmetric & 'bell shaped' • This is characteristic of the Normal Distribution • We can model the shape of such a distribution (i.e. the histogram) by a Curve
Normal Distribution • The Curve may not fit the histogram 'perfectly' - but should be very close • Normal Distribution - two parameters, µ = mean, = standard deviation, • The mathematical formula that gives a bell shaped symmetric curve f(x) = Height of curve at x =
Normal Distribution • Why Not P(x) as before? => because response is continuous • What is the probability that a person sampled at random is 6 foot? • Equivalent question: what proportion of people are 6 foot? • => really mean what proportion are • 'around 6 foot' ( as good as the measurement device allows) - so not really one value, but many values close together.
Example: What proportion of graduates earn €35,000? • Would we exclude €35,000.01 or €34,999.99? • Round to the nearest €, €10, €100, €1000? • Continuous measure => more useful to get proportion from €35,000 - €40,000 • Some Mathematical Jargon: • The formula for the normal distribution is formally called the normal probability density function (pdf)
Can visualise this using the histogram of salaries. The Shaded portion of the Histogram is the Proportion of interest
Since the histogram of salaries is symmetric and bell shaped, we model this in statistics with a Normal distribution curve. Proportion = the proportion of the area of the curve that is shaded • So proportions • = proportional area under the curve • = a probability of interest • Need; • To know , • To be able to find area under curve
Area under a curve is found using integration in mathematics. • In this case would need a technique called numerical integration. • Total area under curve is 1. • However, the values we need are in Normal Probability Tables.