Confounding
Principles of Epidemiology for Public Health (EPID600). Confounding. Victor J. Schoenbach, PhD www.unc.edu/~vschoenb/ Department of Epidemiology Gillings School of Global Public Health University of North Carolina at Chapel Hill www.unc.edu/epid600/.


Confounding
E N D
Presentation Transcript
Principles of Epidemiology for Public Health (EPID600) Confounding Victor J. Schoenbach, PhDwww.unc.edu/~vschoenb/ Department of EpidemiologyGillings School of Global Public HealthUniversity of North Carolina at Chapel Hill www.unc.edu/epid600/ Confounding
“Brain Cramps” "interesting" comments by well-known people (Received from Natasha Jamison, EPID160 graduate)
That’s what can be further from the truth! “I was provided with additional input that was radically different from the truth. I assisted in furthering that version.” – Colonel Oliver North, from his Iran-Contra testimony.
Equal opportunity employer “We don't necessarily discriminate. We simply exclude certain types of people.” – Colonel Gerald Wellman, ROTC Instructor.
Quite a high risk, I’d say “If we don't succeed, we run the risk of failure.” – President Bill Clinton
Why I’m glad no one is taping me “We are ready for an unforeseen event that may or may not occur.” – Vice President Al Gore
We are here • [Now leaving] Sources of error Confounding • [Now entering] Data analysis and interpretation Causal inference Confounding
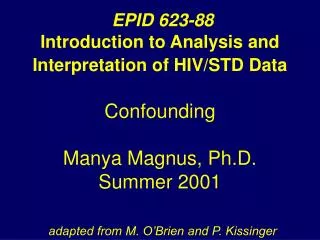
Setting the scene “The data speak for themselves.” versus “Our data say nothing at all.” (Epidemiology guru Sander Greenland, Congress of Epidemiology 2001, Toronto) Confounding
Setting the scene • Logically sound inferences involve(1) data + (2) assumptions • No assumptions no inference • So always need a conceptual model Sander Greenland, Congress of Epidemiology 2001, Toronto Confounding
Causal inference in everyday living Does exercise make me feel better? • Try getting exercise – how do I feel? • Try not getting exercise – how do I feel? • Try getting exercise again – do I feel better? Confounding
Causal inference in everyday living Does getting too little sleep make me irritable? • Try sleeping too little – ask my partner • Try sleeping enough – ask my partner • Try sleeping too little – ask my partner Confounding
Desirable attributes of crossover experiments • Exposure is under investigator’s control • Comparison condition is a true control • Can go back and forth, providing some control for secular changes Confounding
Constraints on cross-over experiments • Exposures may be harmful or not under our control • Effects may not be quickly reversible • Experimental subjects or the environment may have changed Confounding
Key attribute of crossover experiments Can compare what happens to people who are exposed to what happens to the same people when they are not exposed – almost at the same time Confounding
People Confounding
People with an exposure Confounding
Same people without the exposure Confounding
With the exposure O O O O Confounding
Without the exposure O O Confounding
Modern formulation of causal inference This comparison provides the best evidence that the exposure causes the outcome. The modern formulation of causal inference and confounding is based on this “counterfactual model”. Confounding
Problem of causal inference Problem: cannot observe both conditions Solution: observe a “substitute population”, a population whose experience will represent that of the exposed population without the exposure Confounding
“Counterfactual” model Conceptual model for causal inference: • Compare experience of a population exposed to a factor with experience of the same population at the same time but without the exposure • Since cannot do that, compare to experience of a substitute population. Confounding
Confounding The substitute population is not equivalent to the counterfactual condition. I.e., the substitute population does not show the “outcome in the exposed population without the exposure”. Confounding
Problem of comparison Confounding is a problem of comparison – we compare the exposed population to a substitute population, but the substitute population does not show the “outcome in the exposed population without the exposure” Confounding
Why worry about confounding? • Does air pollution cause bronchitis ? Confounding
Why worry about confounding? • Does air pollution cause bronchitis ? Have choices and power Breathe polluted air Develop bronchitis ? Confounding
Why worry about confounding? • Does air pollution cause bronchitis ? • Do seatbelts reduce crash injuries? Risk averse ↓Injured in a crash Wear seatbelts ? Confounding
Why worry about confounding? • Does air pollution cause bronchitis ? • Do seatbelts reduce crash injuries? • Do STD’s increase HIV transmission? Risky sex STD HIV ? Confounding
Why worry about confounding? • Does air pollution cause bronchitis ? • Do seatbelts reduce crash injuries? • Do STD’s increase HIV transmission? • Does smoking lead to illicit drug use? Confounding
Three questions • What comparison should we make according to the counterfactual model? • What comparison will we make instead (i.e., what substitute population will we use for the comparison)? • How likely is this substitute population to show us what will happen in the exposed population without its exposure F Confounding
Learning objectives • Understand (basic) confounding • Recognize potential confounding and actual confounding • Know how to control confounding • Follow discussions about confounding Confounding
Learning objectives - 2 • Define and explain: – confounding – potential confounder – actual confounder – control of confounding Confounding
Conventional perspective Confounding: “mixing of effects” > Some other risk factor may be responsible for at least some of the association under investigation. Confounding
Common confounders • Age -- e.g., exposed persons are older • Sex -- e.g., more exposure in men • Risk factors - more exposed persons (or unexposed) smoke(-), exercise(+), eat vegetables(+), use drugs(-), . . . Confounding
Example of confounding in a cohort Baseline _____________________ follow-up Diseased Not diseased Confounding
Cohort study – known risk factor Risk factor absent _____________________ Risk factor present Confounding
Cohort study – known risk factor Risk factor absent _____________________ Risk factor present - - - - - - - - - - - - follow-up - - - - - - - - - - - - Diseased Not diseased Confounding
follow-up Exposed follow-up Cohort study for a new exposure (Not angry) (Angry) Unexposed Exposed Not Diseased Diseased Not Diseased Diseased Confounding
Exposed Confounding in a cohort (Not angry) (Angry) Unexposed Exposed Unexposed population is the “substitute population” to tell us what would happen in the exposed population without its exposure - but suppose that the exposed population have another risk factor: Confounding
Exposed Confounding in a cohort (Not angry) (Angry) Unexposed Exposed Substitute population will not show us what would happen in the exposed population without its exposure Confounding
Exposed follow-up follow-up Confounding in a cohort (Not angry) (Angry) Unexposed Exposed Not Diseased Not Diseased Diseased Diseased Confounding
Exposed follow-up follow-up Cohort members without the potential confounder (Not angry) (Angry) Unexposed Exposed Not Diseased Not Diseased Diseased Diseased Confounding
Exposed follow-up follow-up Cohort members with the potential confounder (Not angry) (Angry) Unexposed Exposed Not Diseased Not Diseased Diseased Diseased Confounding
Exposed follow-up follow-up Cohort members without the potential confounder (Not angry) (Angry) Unexposed Exposed 2,500 8,300 Not Diseased Not Diseased Diseased Diseased 166 100 2,400 8,134 Confounding
Exposed follow-up follow-up Cohort members without the potential confounder (Not angry) (Angry) Unexposed Exposed 2,500 8,300 Not Diseased Not Diseased Diseased Diseased 166(0.02=2%) 100 (0.04=4%) 2,400 8,134 Confounding
Exposed follow-up follow-up Cohort members without the potential confounder (Not angry) (Angry) Unexposed Exposed 2,500 8,300 RR=0.04/0.02=2.0 Not Diseased Not Diseased Diseased Diseased 100 (0.04) 166 (0.02) 2,400 8,134 Confounding
Exposed follow-up follow-up Cohort members with the potential confounder (Not angry) (Angry) Unexposed Exposed 2,500 1,700 Not Diseased Not Diseased Diseased Diseased 68 200 2,300 1,632 Confounding
Exposed follow-up follow-up Cohort members with the potential confounder (Not angry) (Angry) Unexposed Exposed 2,500 1,700 Not Diseased Not Diseased Diseased Diseased 200(0.08=8%) 68(0.04=4%) 2,300 1,632 Confounding
Exposed follow-up follow-up Cohort members with the potential confounder (Angry) (Not angry) Unexposed Exposed 2,500 1,700 RR=0.08/0.04=2.0 Not Diseased Not Diseased Diseased Diseased 68(0.04) 200 (0.08) 2,300 1,632 Confounding
Exposed follow-up follow-up The entire cohort (Not angry) (Angry) Unexposed Exposed 2,500 2,500 8,300 1,700 Not Diseased Not Diseased Diseased Diseased 166+68 100+200 2,400+2,300 8,134+1,632 Confounding