Modeling Anxiety in Mice: Elevated Plus Maze and Genome-Environment Interactions
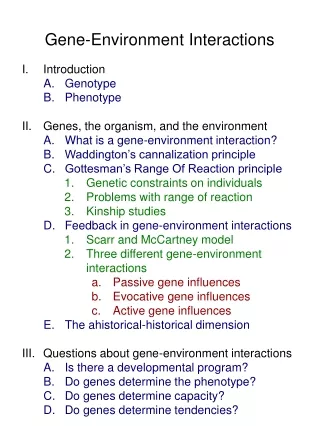
This practical guide explores the effects of genetic and environmental factors on anxiety-related behaviors using the Elevated Plus Maze (EPM) model in mice. It covers hypothesis testing (H0, H1, H2, H3) and includes steps for conducting a genome scan with gender effects. Participants will learn how to analyze phenotypes in relation to sex and chromosomes, using techniques such as ANOVA and advanced intercross lines (AILs). Key methods for QTL mapping and haplotype reconstruction are also discussed, providing insights into the interplay between genetics and environment.

Modeling Anxiety in Mice: Elevated Plus Maze and Genome-Environment Interactions
E N D
Presentation Transcript
Modelling E, G and GxE H0: phenotype ~ 1 H1: phenotype ~ covariate H2: phenotype ~ covariate + LocusX H3: phenotype ~ covariate + LocusX + covariate:LocusX
PRACTICAL: Inclusion of gender effects in a genome scan To start: 1. Copy the folder faculty\valdar\FridayAnimalModelsPractical to your own directory. 2. Start R 3. File -> Change Dir… and change directory to your FridayAnimalModelsPractical directory 4. Open Firefox, then File -> Open File, and open “gxe.R” in the FridayAnimalModelsPractical directory
H0: phenotype ~ sex H1: phenotype ~ sex + marker
scan.markers(Phenotype ~ Sex + MARKER, • h0 = Phenotype ~ Sex, • ... etc) H0: phenotype ~ sex H1: phenotype ~ sex + marker
scan.markers(Phenotype ~ Sex + MARKER, • h0 = Phenotype ~ Sex, • ... etc) H0: phenotype ~ sex H1: phenotype ~ sex + marker
scan.markers(Phenotype ~ Sex + MARKER, • h0 = Phenotype ~ Sex, • ... etc) H0: phenotype ~ sex H1: phenotype ~ sex + marker
head(ped.gender0) • anova(lm(Phenotype ~ Sex + m1 + Sex:m1, data=ped.gender0)) • head(ped.gender1) • anova(lm(Phenotype ~ Sex + m1 + Sex:m1, data=ped.gender1)
New approaches • Advanced intercross lines • Genetically heterogeneous stocks
F2 Intercross x F1 Avg. Distance Between Recombinations F2 intercross ~30 cM F2
Advanced intercross lines (AILs) F0 F1 F2 F3 F4
Chromosome scan for F12 QTL goodness of fit (logP) significance threshold 0 100cM position along whole chromosome (Mb) Typical chromosome
PRACTICAL: AILs To start: 1. Open Firefox, then File -> Open File, and open “ail_and_ghosts.R” in the FridayAnimalModelsPractical directory
F2 Intercross x F1 Avg. Distance Between Recombinations F2 intercross ~30 cM F2
Heterogeneous Stock F2 Intercross x Pseudo-random mating for 50 generations F1 Avg. Distance Between Recombinations: HS ~2 cM F2 intercross ~30 cM F2
Heterogeneous Stock F2 Intercross x Pseudo-random mating for 50 generations F1 Avg. Distance Between Recombinations: HS ~2 cM F2 intercross ~30 cM F2
Relation Between Marker and Genetic Effect QTL Marker 1 Observable effect
Relation Between Marker and Genetic Effect QTL Marker 2 Marker 1 Observable effect
Relation Between Marker and Genetic Effect QTL Marker 2 Marker 1 No effect observable Observable effect
Multipoint method (HAPPY) calculates the probability that an allele descends from a founder using multiple markers Observed chromosome structure Hidden Chromosome Structure
Haplotype reconstruction using HAPPY chromosome genotypes haplotype proportions predicted by HAPPY
Many peaks mean red cell volume
How to select peaks: a simulated example Simulate 7 x 5% QTLs (ie, 35% genetic effect) + 20% shared environment effect + 45% noise = 100% variance
Peaks from 1D scan phenotype ~ covariates + ?
1D scan: condition on 1 peak phenotype ~ covariates + peak 1 + ?
1D scan: condition on 2 peaks phenotype ~ covariates + peak 1 + peak 2 + ?
1D scan: condition on 3 peaks phenotype ~ covariates + peak 1 + peak 2 + peak 3 + ?
1D scan: condition on 4 peaks phenotype ~ covariates + peak 1 + peak 2 + peak 3 + peak 4 + ?
1D scan: condition on 5 peaks phenotype ~ covariates + peak 1 + peak 2 + peak 3 + peak 4 + peak 5 + ?
1D scan: condition on 6 peaks phenotype ~ covariates + peak 1 + peak 2 + peak 3 + peak 4 + peak 5 + peak 6 + ?
1D scan: condition on 7 peaks phenotype ~ covariates + peak 1 + peak 2 + peak 3 + peak 4 + peak 5 + peak 6 + peak 7 + ?
1D scan: condition on 8 peaks phenotype ~ covariates + peak 1 + peak 2 + peak 3 + peak 4 + peak 5 + peak 6 + peak 7 + peak 8 + ?