Download
1 / 20
200 likes | 272 Vues
Detailed review of research methods chapters, focus on scale, reliability, validity, sampling, experimental designs, statistical analysis, and epidemiology concepts.

E N D
PTP 560 • Research Methods Week 12 Thomas Ruediger, PT
April 5th is last 5 chapters-comprehensive review April 12th Final Bulk of final 80% Chap. 4,5,6 Underpinning for Scale, reliability, validity, chap 8 Sampling, 10 Experimental Designs, 17-21, 23, 24, 26, 27 Last 20%: 16, 22,25,28,29,32,34
Independent T-test • If the top row of Levene’s Sig is >.05, then do NOT assume equal variances and use the bottom row of chart. • If we research sig. then the t-stat has to be bigger than the critical value. If t-stat is bigger than critical then REJECT the NULL (because there is a difference) • The bigger the t-stat then will have a better chance of being bigger than the critical value.
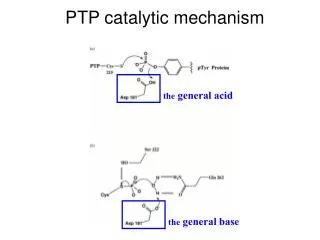
Validity Truth 1-Sn = - LR + Sp Sp = d/b+d + a b Test - c d Sn Sn = a/a+c + LR = 1-Sp
ValidityRuling in/Ruling Out • SpPin • With high Specificity, • a Positive tests rules in the diagnosis • SnNout • With high Sensitivity, • a Negative tests rules out the diagnosis
ValidityPretest Posttest Probability • Pretest • What we think might be the problem • Conceptually a “best guess” • However, it is enhanced by pertinent literature • Influenced by your clinical experience • Posttest • Revised probability based on test outcome • Likelihood ratios widely used in PT literature • +LR • How many more times a positive test will be seen in those with the disorder than without the disorder • -LR • How many more times a negative test will be seen in those with the disorder than without the disorder
Receiver Operating Characteristic (ROC) Curves • Strikes a balance between • Sensitivity • Specificity • So that we can trade-off over and under diagnosing. • Construction • Set several cutoff points • Plot Sensitivity and 1-Specificity • Interpret • Visually - which is best diagnostic tool? • Mathematically the Area under the curve is best diagnostic trade-off • Decide on Cutoff • Based on the impact of incorrect decision
Receiver Operating Characteristic (ROC) Curves 50:50 www.openmedicine.ca/article/viewArticle/63/61
Clinical Prediction Rules • Incorporates Sensitivity, Specificity • Quantifies the contributions of different variables • Used to increase diagnostic utility • Is the patient at risk for a certain outcome? • Does the patient have this pathology • Ottawa ankle rules a good example
Measuring Change • MDD=can we find a difference one test to another • MCID=can you find a difference being made for patients • Distribution based methods (normalized data) • Effect Size Index • Standardized Response Mean • Guyatt’s Responsiveness Index • Standard Error of the Measurement • Anchor Based Methods (like a pain scale) • Global Rating of Change • Ordinal scale based on subjective rating of change • Global Rating Scale common Scale
Epidemiology • Distribution and determinants of: • Disease • Injury • Dysfunction • Descriptive • Analytic
Descriptive Epidemiology • Incidence: the amount of new cases • May be cumulative • Number of new cases (during a given period) Total population at risk • May be in person-time (used to be • Number of new cases (during a given period) Total person time • Prevalence: the amount of all cases (new & old) • Number of existing cases (during a given period) Total population at risk • Relationship between Incidence and Prevalence
Analytic Epidemiology • Relative vs. Absolute Effects • Ratio vs. Actual difference • Relative Risk • Likelihood that exposed person gets disease • Odds Ratio • Analogous to RR • Applicable to Case-Control Situation
Analytic Epidemiology • Event Rates and Risk Reduction • Experimental Event Rate (EER): with exposure • Control Event Rate (CER): without exposure • EER/CER = Relative Risk (RR) • CER-EER/CER = RRR (RR reduction) • CER-EER = ARR (Absolute Risk Reduction)
Analytic Epidemiology • CER-EER = ARR (Absolute Risk Reduction) • 1/ARR = (Number needed to treat) NNT • If represents the number of patients that would be needed to be treated to make a change in their disorder as big as that in the study.
Multivariate AnalysisA one time read thorough is warranted • Examine several variables for interrelationships • Applications to correlation • Partial correlation coefficient • Regression • Multiple independent variables • Beta weights are standardized values for relative weighting • R2 (coefficient of determination) is amount of total variance explained by all IVs • Adjusted R2 corrects for chance • Discriminate Analysis • Analogue to multiple regression • Used with categorical variables