PTP 560
PTP 560. Research Methods Week 8. Thomas Ruediger, PT. Systematic Review and Meta Analysis. Systematic review Structured approach Analysis of myriad information With detailed description of methods and criteria As opposed to classical review If there are

PTP 560
E N D
Presentation Transcript
PTP 560 • Research Methods Week 8 Thomas Ruediger, PT
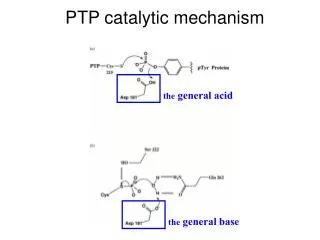
Systematic Review and Meta Analysis Systematic review • Structured approach • Analysis of myriad information • With detailed description of methods and criteria • As opposed to classical review If there are • Sufficient data for further analysis, you can… • Use quantitative index • Develop single estimate of intervention effect • This is now Meta-analysis=statistical analysis of a systematic review Figure 16.1
Levels of evidence • Useful for categorizing • Not owned by Systematic Review and Meta Analysis • 1 (a,b,c) = RCT, systematic review of RCT, CPRs • 2 (a,b) = Cohort Study(ies), systematic reviews • 3 (a,b) = Case Control Study(ies), systematic reviews • 4 = Case series, case control • 5 = Expert opinion or bench (basic) research Table 16.1
Evaluating Methodologic Quality • Study Bias • Selection - How comparison groups are formed • Performance - Differences in provision of care • Attrition - Differential subject loss • Detection - Outcomes assessment differ • Rating Scales • Jadad Scale • Instrument to Measure the Likelihood of Bias • Physiotherapy Evidence Database (PEDro) • Wide use in PT literature (Table 16.3) • QUADAS Scale • Qualitative Assessment of Diagnostic Accuracy Studies
Systematic Review or Meta-Analysis? • Meta-Analysis Powerful • Must have statistical data sufficient for analysis • Adds: • Statistical Power by increasing sample size • Improves effect size estimates • Resolves conflicting results • Improves generalizability • Effect size • The samples not pooled together • Rather, each sample effect size index contributes • Effect size index calculation = mean difference between groups/pooled SD
Presenting Meta-analysis results • Weighted Effect size • As all studies not equal • Larger the sample size, more precise estimate of effect • Forest Plot • Individual studies • Cumulative result • Let’s look at Hooked on Evidence
Descriptive Statistics • Characterize • Shape • Central Tendency • Variability • Parameters are population characteristics • When they are from a sample, statistics
Frequency Distributions • Could look at all the data • Scatterplot excellent for this • Frequency Distribution • 3 – 1s, 4 – 2s, 2 – 5s etc • Grouping may be useful • Graphing • Stem and Leaf • Leaf is the rightmost digit • Stem are the rest • Histogram of scores or classes (groups)
Skewed distributions Mean “pulled” to the tail by extreme measurements
Central Tendency • How is it calculated? • Sum/n • Middle # (or middle two/2) • Most frequent value • What is an average? • Mean • μ for population • X for sample • Median • Mode With Nominal data – Only mode is useful With Ordinal Data – May use mode and/or median Ratio/interval Data – All three measures may be used
Percentiles • A measure of Variability • 100 equal parts • Relative position • 75th percentile • 75% below this • 24% above this • Quartiles a common grouping • 25th (Q1), 50th (Q2), 75th (Q3) , 100th (Q4) • Inter-quartile Range • Distance between Q3-Q1 • Middle 50% • Semi-inter-quartile Range • Half the inter-quartile range • Useful variability measure for skewed distributions
Population Variability • How measurements differ from each other • In total these always sum to zero • Variance handles this • Sum of squared deviations • Divided by the number of measurements • σ2 for population variance • Standard deviation • Square root of variance • σ for population variance
Sample Variability • How measurements differ from each other • In total these always sum to zero • Variance handles this • Sum of squared deviations • Divided by (the number of measurements – 1) • s2 for sample variance • Standard deviation • Square root of variance • s for sample standard deviation
Other Measures of Variability • Range • Difference between highest and lowest • Usually described as • “Mean of 15 years, with a range of 11 to 23 years” • Here the range is 12 • Coefficient of Variation (CV = s/X * 100) • Ratio of standard deviation to the mean, as % • It is independent of units • Good for comparing relative variation • It accounts for differences in magnitude • Excellent PT example in P & W
Statistical Inference • Allow us to test theories and generalize • Inference • Specific to general in logic • Sample to population in research • Probability • “Likelihood that any one event will occur, given ALL possible outcomes
Probability and Distributions • From P & W • All men, • μ = 69 inches, • σ =3 inches • What is the probability (p) • that the next man selected- • will be between 66 and 72 inches tall?-68% • Greater than 78 tall? • Less than ½ percent, only on one size. (.3%/2=.15%)
Sampling Error • Difference between the population and sample • Sampling error of the mean • X - μ • Sampling distribution of means consistently normal • Reflects the Central Limit Theorem • Standard Error of the Mean (σx) • Standard deviation of a sampling distribution (theoretical) • Is an estimate of population standard deviation • sx = s/√n (it is a function of the size of the sample) • We can describe the range of values • within a certain probability, • of having a single sample, • with the mean we find 95% probability, in a single random sample of finding
Confidence Intervals (CI) • Range of scores in which the population mean (μ) lies • Constructed around sample mean, X • X is the Point estimate of μ • CI = X ± (z) s x
Confidence Intervals (CI) • Range of scores in which the population mean (μ) lies • Constructed around sample mean, X • X is the Point estimate of μ • CI = X ± (z) s x “When you see z, think standard deviation.” 1.96 is the most common z in the CI; reflects 95% of the total sampling distribution