
Uploaded by
joey
9 SLIDES
228 VUES
90LIKES
Graphing Linear and Non-Linear Equations: Understanding Functions and Applications
DESCRIPTION
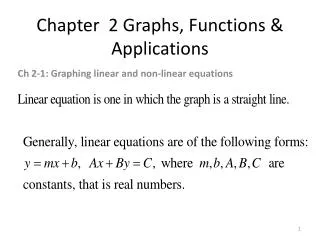
In this chapter, we explore the essential techniques for graphing linear and non-linear equations. We begin by understanding the Cartesian plane and the role of coordinates in plotting points. The section covers the characteristics of linear functions, including slope and intercepts, as well as methods to graph them efficiently. We also delve into non-linear functions, discussing parabolas, circles, and other curves. Practical applications are provided to illustrate how graphing is a fundamental tool in analyzing and solving mathematical problems.
Download
1 / 9
Download Presentation

Télécharger la présentation
Graphing Linear and Non-Linear Equations: Understanding Functions and Applications
An Image/Link below is provided (as is) to download presentation
Download Policy: Content on the Website is provided to you AS IS for your information and personal use and may not be sold / licensed / shared on other websites without getting consent from its author.
Content is provided to you AS IS for your information and personal use only.
Download presentation by click this link.
While downloading, if for some reason you are not able to download a presentation, the publisher may have deleted the file from their server.
During download, if you can't get a presentation, the file might be deleted by the publisher.
E N D
Presentation Transcript
Chapter 2 Graphs, Functions & Applications Ch 2-1: Graphing linear and non-linear equations


More Related
Audio
Live Player