Source: HAO's PSPT project
90 likes | 982 Vues
The Sun Through Different Filters. Source: HAO's PSPT project

Source: HAO's PSPT project
E N D
Presentation Transcript
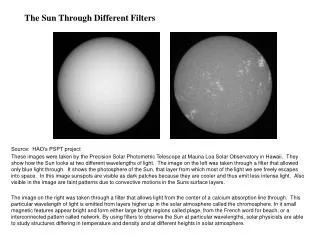
The Sun Through Different Filters Source: HAO's PSPT project These images were taken by the Precision Solar Photometric Telescope at Mauna Loa Solar Observatory in Hawaii. They show how the Sun looks at two different wavelengths of light. The image on the left was taken through a filter that allowed only blue light through. It shows the photosphere of the Sun, that layer from which most of the light we see freely escapes into space. In this image sunspots are visible as dark patches because they are cooler and thus emit less intense light. Also visible in the image are faint patterns due to convective motions in the Suns surface layers. The image on the right was taken through a filter that allows light from the center of a calcium absorption line through. This particular wavelength of light is emitted from layers higher up in the solar atmosphere called the chromosphere. In it small magnetic features appear bright and form either large bright regions called plage, from the French word for beach, or a interconnected pattern called network. By using filters to observe the Sun at particular wavelengths, solar physicists are able to study structures differing in temperature and density and at different heights in solar atmosphere.
The Big Sun Spots Source: http://sohowww.nascom.nasa.gov/ http://www.noao.edu/noao/noaonews/dec03/pdf/76nso.pdf http://www.gsfc.nasa.gov/topstory/20010919sunspot.html These images show examples of enormous sunspots. The one on the left shows an image of the entire Sun to demonstrate how big the spots can get (sometimes as big as several Earth diameters across). The image on the right shows a close up view of a large sunspot. A sunspot is a large concentration of strong magnetic field. In the dark central part, call the umbra, the magnetic field is nearly vertical. In the gray surrounding region, called the penumbra, the magnetic field lies more horizontal. The reason a sunspot is darker that the background is that it is cooler and therefore emits less light at most wavelengths. The reason it is cooler is that the presence of the strong magnetic field inhibits the convective motions (boiling motions) found in the outer layers of the Sun. These motions, visible as granules surrounding the penumbra in the right hand image, transport the heat produced inside the Sun to the surface layers where it radiates away. If the convective motions are restricted the heat is transported less efficiently. The penumbra is less dark than the umbra because the weaker horizontally oriented magnetic fields there inhibit the motions less than the strong vertical fields in the umbra do.
The ‘Open’ vs. ‘Closed’ Corona open closed Source: The eclipse image was taken by the High Altitude Observatory and Rhodes College eclipse team and the computer model was produced by Drs. Jon Linker and Zoran Mikic of the Science Applications International Corporation. On the left is an image of a total solar eclipse on February 26, 1998. The image on the right is a computer model of the sun's magnetic field as it would appear on the same day. The bright coronal regions in the eclipse image correspond to locations in the corona where the solar magnetic field is shaped like loops (i.e. closed) as seen in the model image on the right. These magnetic loops act to trap the solar atmosphere so that greater amounts of material are located in these regions causing them to appear brighter. The darker regions in the eclipse image are locations where the solar corona escapes the sun to form the solar wind, which fills the solar system. The magnetic field lines in these darker regions are drawn out into the solar system (as seen in the model image on the right) and become part of the solar wind.
The Corona In Different Wavelengths Source: The image on the left is of the solar corona seen in visible light in an artificial eclipse image taken on November 1, 2003 with the K-Coronameter at Mauna Loa in Hawaii. The light from the solar disk is ~ 1 million times brighter than the corona therefore the white light corona can only be seen in ‘eclipsed’ images. Visible light images of the corona allow scientists to map the density structure of the corona and are ideal observations for tracking a form of solar activity known as coronal mass ejections. The corona can be detected out to great distances (more than 10 million miles) when viewed in visible light from telescopes in space. The image on the right is of the solar corona seen in extreme ultraviolet (EUV) light taken by the Extreme ultraviolet Imaging Telescope (EIT) on the SOHO spacecraft. In this type of light, scientists can view the corona against the solar disk. No artificial eclipse is needed because the solar disk is dark in EUV wavelengths. EUV images allow the scientists to study the temperature and density structure of the corona and track features as they rotate across the disk of the sun. These observations are ideal for studying solar flares and other coronal disturbances.
The Wide Angle View of The Corona Source: HAO, LASCO, EIT Science teams /NASA This picture was made by combining 3 images of the solar corona. The inner green image shows the very low corona in extreme ultraviolet (EUV) wavelengths as seen against the solar disk. EUV observations are ideal for studying the temperature and density of the corona and for observing events like solar flares. The blue/white images show the inner and outer corona as seen in visible light. Visible light images allow scientists to study the density structure of the corona and are ideal for observing events like coronal mass ejections. The corona can be observed out to great heights in visible light (more than 10 million miles) but multiple telescopes are needed to observe over a wide range of heights because the brightness of the corona changes rapidly with height. The EUV image was taken by the Extreme ultraviolet Imaging Telescope on the SOHO spacecraft, the inner blue/white image of the inner corona was taken by the K-coronameter on Mauna Loa in Hawaii, and the blue/white image of the outer corona was taken by the LASCO C2 coronagraph on the SOHO spacecraft. The earth would be a tiny dot in this image.
The 11 Year Sunspot Cycle near minimum solar max Source: http://web.hao.ucar.edu/public/slides/slide20.html The polarity of the Sun’s global magnetic field reverses every ~11 years, forming a complete cycle every ~22 years. The amount of magnetic field present on the Sun varies with time, increasing and decreasing with a fairly regular period of 11 years. The number of sunspots visible on the Sun at any one time reflects this cycle, as seen in the central plot of the above figure, but that is not the only change which occurs. The whole solar atmosphere adjusts to the changes in surface magnetic field distribution. The top row of images are X-ray images of the Sun taken with the Yohkoh spacecraft. They show the decrease in X-ray output of the Sun as the magnetic activity decreases at the end of one particular solar cycle. The bottom row shows how the outer solar atmosphere, called the corona, changes with solar cycle. These are eclipse photographs spanning the period between 1966 and 1988, with the exception of the image for 1985 which was constructed using data from the Solar Maximum Mission spacecraft. When the few magnetic sunspots are present on the Sun, called solar minimum, the closed (bright) regions of the corona are confined to lower latitudes centered around the solar equator. At solar minimum, the global magnetic dield on the sun resembles a simple dipole field, like that produced by a bar magnet. When many magnetic regions are present, the corona appears more symmetric, with closed (bright) structures located at all latitudes. These differences in the appearance of the corona are caused by changes in the magnetic field structures which thread it. near max near minimum
The Coronal Mass Ejections HAO Collection Source: http://web.hao.ucar.edu/public/slides/slides.html; Slide: 13; Date: August 28, 1980; Imaging Technique: White Light In general, the magnetic field, like gravity, acts to hold down the solar atmosphere. However, the temperature of the solar corona is about a million degrees (100 times greater than the solar surface). These high temperatures and the presence of stresses on the coronal magnetic field, act to drive the atmosphere outward. Previously closed magnetic regions can become unstable resulting in a sudden ejection of coronal plasma and magnetic field into the solar wind, known as Coronal Mass Ejections (CMEs). This set of images shows a CME from 10:04 to 13:34 on August 28, 1980. Large ejections, such as the one pictured here, send upwards of 1013 kg of coronal material into space at rates of 100 km/s or more (although average values are closer to ~ 1012 kg and 400 km/s). The CME originates from a helmet streamer -- the bright, pointed feature seen in the lower half of the first two images of the sequence -- which is blown out by the passage of the CME. When CMEs are Earthward directed, they can affect communications, navigation systems, even power grids, while also producing auroras visible in the night skies
The Prominences Best of SOHO images Source: http://sohowww.nascom.nasa.gov/bestofsoho/(note higher resolution TIF is available there) Date: 24 July 1999 Imaging Technique: He II at 304 Angstroms Title: Solar prominence Description: Erupting prominences are perhaps the most common type of solar activity associated with coronal mass ejections (CMEs) and may play a fundamental role in the formation of CMEs. This is an image of a large, eruptive prominence as seen in ultraviolet light in ionized helium (He II) at 304Å, with an image of the Earth added for size comparison. Solar prominences are relatively cool, high density material suspended in the solar atmosphere. This prominence from 24 July 1999 is particularly large and looping, extending over 35 Earths out from the Sun. Erupting prominences are often components of CMEs, and, when Earthward directed, can affect communications, navigation systems, even power grids, while also producing auroras visible in the night skies.
The Flares Sources: GOES Xray flux image from NOAA/SEC Boulder http://www.sec.noaa.gov/SOHO/EIT 195 Angstrom image http://sohowww.nascom.nasa.gov/hotshots/2003_11_04/A solar flare is a dramatic release of stored-up solar magnetic energy into the solar atmosphere. It is a sudden brightening across a limited region of the sun. Radiation is emitted at virtually every wavelength, from radio, to visible, to X-ray. The biggest solar flare observed to date, occurring on November 4, 2003. The first, solar image shows the flare as a bright flash in extreme ultraviolet (EUV) radiation (SOHO/EIT 195 Angstrom emission). Flares are classified based on their brightness in X-ray emission -- the second image of NASA GOES integrated X-ray flux vs. time shows that the flare on November 4, 2003 was the fourth and biggest so-called "X" class flare occurring over the course of a few days -- it set the record at X28.