Download

1 / 28
290 likes | 710 Vues
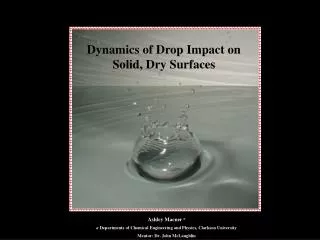
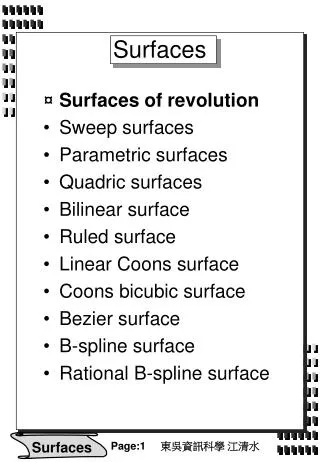
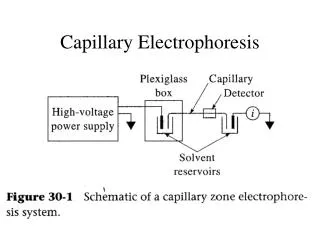
Dynamics of Capillary Surfaces. Lucero Carmona Professor John Pelesko and Anson Carter Department of Mathematics University of Delaware. Explanation. When a rigid container is inserted into a fluid, the fluid will rise in the container to a height higher than the surrounding liquid. Tube.

E N D
Dynamics of Capillary Surfaces Lucero Carmona Professor John Pelesko and Anson Carter Department of Mathematics University of Delaware
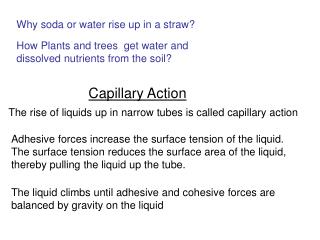
Explanation • When a rigid container is inserted into a fluid, the fluid will rise in the container to a height higher than the surrounding liquid Tube Wedge Sponge
Goals • Map mathematically how high the liquid rises with respect to time • Experiment with capillary surfaces to see if theory is in agreement with data • If the preparation of the tube effects how high the liquid will rise
Initial Set-up and Free Body Diagram List of Variables: volume = g = gravity r = radius of capillary tube Z = extent of rise of the surface of the liquid, measured to the bottom of the meniscus, at time t ≥ 0 = density of the surface of the liquid - = surface tension = the angle that the axis of the tube makes with the horizontal of the stable immobile pool of fluid = contact angle between the surface of the liquid and the wall of the tube
Explanation of the Forces • Surface Tension Force • Gravitational Force • Poiseulle Viscous Force
Explanation of the Forces • End-Effect Drag • Newton's Second Law of Motion
Explanation of Differential Equation • From our free body diagram and by Newton's Second Law of Motion: • Net Force = Surface Tension Force - End-Effect Drag - Poiseuitte Viscous Force - Gravitational Force • Net Force + End-Effect Drag + Poiseuitte Viscous Force + Gravitational Force - Surface Tension Force = 0 • After Subbing back in our terms we get: • By Dividing everything by we get our differential equation: where Zo = Z(0) = 0
Steady State • By setting the time derivatives to zero in the differential equation and solving for Z, we are able to determine to steady state of the rise
Set - Up • Experiments were performed using • silicon oil and water • Several preparations were used on the set-up to see if altered techniques would produce different results • The preparations included: • Using a non-tampered tube • Extending the run time and aligning the camera • Aligning the camera and using an non-tampered tube • Disinfecting the Tube and aligning the camera • Pre-wetting the Tube and aligning the camera
Set - Up • The experiments were recorded with the high speed camera. • The movies were recorded with 250 fps for Silicon Oil and 1000 fps for water. • Stills were extracted from the videos and used to process in MatLab. • 1 frame out of every 100 were extracted from the Silicon Oil experiments so that 0.4 of a second passed between each frame. • 1 frame out of every 25 were extracted from the Water experiments so that 0.025 of a second passed between each frame.
Set - Up • MatLab was then used to measure the rise of the liquid in pixels • Excel and a C-program were used to convert the pixel distances into MM and to print out quick alterations to the data Z
Capillary Tubes with Silicon Oil Silicon Oil Data: Steady State Solution Initial Velocity Eigenvalues
Capillary Tube with Water Water Data: Steady State Solution Initial Velocity Eigenvalues
Previous Experimental Data (Britten 1945) Water Rising at Angle Data: Steady State Solution Initial Velocity Eigenvalues
Results • There is still something missing from the theory that prevents the experimental data to be more accurate • The steady – state is not in agreement with the theory • There is qualitative agreement but not quantitative agreement • Eliminated contamination
Explanation of Wedges • When a capillary wedge is inserted into a fluid, the fluid will rise in the wedge to a height higher than the surrounding liquid Goals • Map mathematically how high the liquid rises with respect to time
Wedge Set - Up • Experiments were performed using • silicon oil • Two runs were performed with different angles • Experiments were recorded with the high speed camera at 250 fps and 60 fps
Wedge Set - Up • For first experiment, one still out of every 100 were extracted so that 0.4 sec passed between each slide • For second experiment, one still out of every 50 were extracted so that 0.83 sec passed between each slide • MatLab was then used to measure the rise of the liquid in pixels • Excel and a C-program were used to convert the pixel distances into MM and to print out quick alterations to the data Z
Explanation of Sponges • Capillary action can be seen in porous sponges Goals • To see if porous sponges relate to the capillary tube theory by calculating what the mean radius would be for the pores
Sponge Set - Up • Experiments were performed using • water • Three runs were preformed with varying lengths • Experiments were recorded with the high speed camera at 250 fps and 60 fps
Sponge Set - Up • For first and second experiments, one still out of every 100 were extracted so that 0.4 sec passed between each slide • For third experiment, one still out of every 50 were extracted so that 0.83 sec passed between each slide • MatLab was then used to measure the rise of the liquid in pixels • Excel and a C-program were used to convert the pixel distances into MM and to print out quick alterations to the data Z
Sponge Data The effects of widths and swelling
Future Work • Refining experiments to prevent undesirable influences • Constructing a theory for wedges and sponges • Producing agreement between theory and experimentation for the capillary tubes • Allowing for sponges to soak overnight with observation
References • Liquid Rise in a Capillary Tube by W. Britten (1945). Dynamics of liquid in a circular capillary. • The Science of Soap Films and Soap Bubbles by C. Isenberg, Dover (1992). • R. Von Mises and K. O. Fredricks, Fluid Dynamics (Brown University, Providence, Rhode Island, 1941), pp 137-140. Further Information • http://capillaryteam.pbwiki.com/here
Explanation of the Forces (u, v, w) u - velocity in Z-dir v - velocity in r -dir w - velocity in θ-dir Since we are only considering the liquid movement in the Z-dir: u = u(r) v = w = 0 The shearing stress,τ, will be proportional to the rate of change of velocity across the surface. Due to the variation of u in the r-direction, where μ is the viscosity coefficient: Since we are dealing with cylindrical coordinates From the Product Rule we can say that: • Poiseulle Viscous Force: Solving for u:
Explanation of the Forces If then: Sub back into the original equation for u: So then for : From this we can solve for c: Sub back into the equation for u: • Poiseulle Viscous Force: Average Velocity:
Explanation of the Forces Equation, u, in terms of Average Velocity • Poiseulle Viscous Force: Further Anaylsis on shearing stress, τ: for , The drag, D, per unit breadth exerted on the wall of the tube for a segment l can be found as: