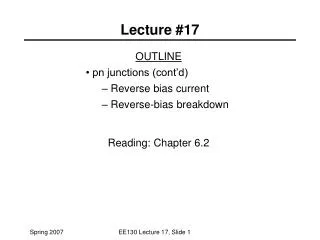
Welfare Programs Lecture 17
Welfare Programs Lecture 17. Today’s readings: Schiller Ch 12, Welfare Programs Ehrenberg and Smith, “ Supply of Labor to the Economy, ” eReserves House Ways and Means Committee 2004 Green Book, http://www.gpoaccess.gov/wmprints/green/2004.html


Welfare Programs Lecture 17
E N D
Presentation Transcript
Welfare ProgramsLecture 17 Today’s readings: Schiller Ch 12, Welfare Programs Ehrenberg and Smith, “Supply of Labor to the Economy,” eReserves House Ways and Means Committee 2004 Green Book, http://www.gpoaccess.gov/wmprints/green/2004.html DeParle, Ch. 14: Golf Balls and Corporate Dreams: Milwaukee, 1997-1999
Today’s Questions • What means-tested welfare programs are available for poor people in the United States? • How much do these programs cost? • How many people are helped by these programs? • How are welfare benefits determined? • Why is welfare so hard to reform?
What means-tested welfare programs are available for poor people in the U.S.? • Federal and State governments funded 85 welfare programs in FY 2002 at a total cost of $522 billion. • Federal Share: 71% • State and Local Share: 29% • The means-tested programs fall into 8 different categories. • Source for Slides 3-24: House Ways and Means Committee 2004 Green Book, http://www.gpoaccess.gov/wmprints/green/2004.html
Eight Categories of Welfare Programs and Total Costs, 2002 • Medical Aid: $282 billion, 54% • Cash Aid: $102 billion, 20% • Food Aid: $39 billion, 7% • Housing Aid: $36 billion, 7% • Education Aid: $30 billion, 6% • Other Services: $22 billion, 5% • Jobs and Training Aid: $8 billion, 2% • Energy Aid: $2 billion, 0.3%
Analysis of spending • 54 cents of every welfare dollar went for medical assistance • 80% of State and Local dollars went to medical aid • Spending in each of 6 programs exceeds $10 billion and accounts for 77 percent of total spending.
7 largest programs by amount spent • Medicaid ($258 billion) • SSI ($39 billion) • EITC ($28 billion) • Food Stamps ($24 billion) • TANF cash, ,services, child care, and work activities ($24 billion) • Section 8 low-income housing assistance ($18 billion) • Pell Grants ($11)
Trends in Spending • Real spending for cash and non-cash programs increased by 523 percent from FY1968 to FY2002. • Real spending for cash and non-cash programs increase 36 percent between FY1992 and FY2002. • Average annual rate of growth over this 32 year period was 5.5 percent. • The U.S. population increased by 43 percent over this period. • Real total per capita spending grew from $416 in FY1968 to $1,826 in FY 2002.
Spending Trends by Type of Aid FY1968-FY2002 (Constant FY 2002 Dollars) Medical+Cash+Food+Housing Aid=.88 x Total Spending
Trends in Spending by Level of Government, FY1968-FY2002 (Constant FY 2002 Dollars)
Trends in Federal SpendingFY1968-FY2002 (Constant FY 2002 Dollars) • Real Federal spending climbed from $60 billion in FY1968 to $373 billion in FY 2002, an increase of 529 percent. • Cash aid was the leading form of Federal welfare until 1980 when medical aid overtook it.
Trends in State and Local SpendingFY1968-FY2002 (Constant FY 2002 Dollars) • State and Local real spending climbed from $24.5 billion in FY1968 to $149 billion in FY2002, an increase of 508 percent. • Medical assistance overcame cash aid as the leading form of income-tested assistance in1976.
Share of Federal Budget used for Income-Tested Aid, FY1968-2002
Participation in Means-tested Programs, 2002 • We do not have an unduplicated count of welfare beneficiaries • Average 2002 monthly numbers: • Medicaid: 50.9 million persons • Food stamps: 20.2 million recipients • SSI: 6.9 million recipients • TANF: 5.1million recipients • EITC: 16.8 million tax filers
Source: CBO Economic and Budget Issue Brief, “Changes in Participation in Means-Tested Programs” http://www.cbo.gov/ftpdocs/63xx/doc6302/04-20-Means-Tested.pdf
Predicting Future Participation • Assuming no legislative changes, future levels of participation in means-tested welfare programs will depend on: • Demographic trends • Distribution of income • The state of the economy
Participation in Means-tested Programs by Poor Persons, 2002 • Census Bureau found 23 million poor persons (two out of every three with pre-tax money income below the poverty threshold) lived in a household that received means-tested assistance. • Percent of the poverty population living in a household that received: • Medicaid: 53 percent • Food Stamps: 33 percent • cash assistance: 22 percent • Subsidized or public housing: 18 percent
Participation by Total Population, 2002 • Percent of the total population living in a household that received: • Medicaid: 19 percent • Food Stamps: 6 percent • cash assistance: 7 percent • Subsidized or public housing: 4 percent • Some form of major means-tested aid: 25 percent
Eligibility vs. Participation • To be eligible, a person, family or household must satisfy conditions regarding • Citizenship • Demographic characteristics (children present?) • Countable income • Accumulated wealth (assets including cars, homes, insurance policies, bank accounts) • Employment status
Eligibility vs. Participation • Participation refers to actual receipt of cash, non-cash benefits, or services. • Not all eligible persons participate. • Participation rates = participating population/eligible population • Participation levels/rates depend upon: • Demographic trends, labor market conditions, distribution of income, health care costs, and the level of benefits.
Eligibility vs. Participation, cont • An individual’s decision depends on the net benefits of participation: • Net benefits=Gross Benefits-Costs • Gross Benefits include: • Primary benefits (cash, non-cash, services) • Secondary benefits (eligibility for subsequent programs depends on enrollment in the primary program • Costs include: • Hassle • Transportation • documentation • Stigma
How are benefits determined? • Generic formula: B=G - t(E-DE) - (U-DU), where • B=Benefit level • G=Maximum benefit (other income=0) • T=marginal tax rate • E=gross earnings • DE=earnings disregard • U=non-earnings incomes (pensions, interest) • DU=non-earnings disregard
Source: House Ways and Means Committee 2004 Green Book, pp. 38-39 http://www.gpoaccess.gov/wmprints/green/2004.html
How are benefits determined?, cont. • Note that in the preceding table grants vary with family size up to 6 persons. • Example using Texas: • Assume a mother of two works 30 hours a week for 4.2 weeks at the minimum wage $5.15 per hour. She has no other income. • B=$201-.67($649-30)=$201 - 415=-$214 • Source: Work Related Provisions of State TANF Plans http://www.acf.dhhs.gov/programs/ofa/WRKREL.HTM
Benefit Calculation, cont. • In the previous example, the mother would not receive a benefit. Negative benefits are raised to $0. • At the level of work hours (30) required by Federal law for a TANF mother to qualify as a work recipient, our Texas mother is not eligible for benefits. At what level of earnings could she receive benefits?
Calculating Break-even Level of Earnings • Recall that B=G - t(E-DE) - (U-DU). • Set B=0, and solve for E: • Generally, EB=G/t + D, when U=0. • In our example, the Texas mother would be eligible for cash benefits if her earnings were less than $330. • EB=201/.67+30 • EB=$330 She loses eligibility if she works more than 15.25 hours per week.
Source: House Ways and Means Committee 2004 Green Book, pp.36-37, http://www.gpoaccess.gov/wmprints/green/2004.html
Source: CBO Economic and Budget Issue Brief, “Changes in Participation in Means-Tested Programs” http://www.cbo.gov/ftpdocs/63xx/doc6302/04-20-Means-Tested.pdf
Source: House Ways and Means Committee 2004 Green Book, pp.45-47, http://www.gpoaccess.gov/wmprints/green/2004.html
Source: House Ways and Means Committee 2004 Green Book, p. 89 http://www.gpoaccess.gov/wmprints/green/2004.html
Why is welfare so hard to reform? • We can gain insight into the difficulty of reforming welfare by considering the implications of the break-even earnings formula: EB=G/t + D
Why is welfare so hard to reform?, cont. • Traditionally, policy makers heed three goals: • Adequacy • Cost minimization • Encouraging independence through work
Why is welfare so hard to reform?, cont. • Policy makers have three parameters they can alter to achieve these goals: • G, maximum guarantee • t, marginal tax rate • D, the earnings disregard • Given the relationship of G, t, and D, at most two of the three goals can be achieved at any one time.
Why is welfare so hard to reform?, cont. • Welfare is so difficult to reform, that is it is difficult to find a long-lasting policy equilibrium, because our political parties differ in the emphasis they give the three goals. Traditionally, • Republicans pursed cost minimization and promoting work above adequacy, while Democrats championed adequacy.