Download
1 / 10
100 likes | 117 Vues
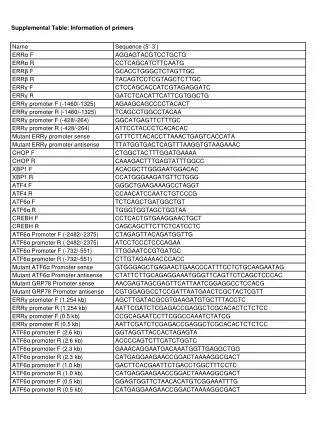
This study investigates the functionality of p53 and its correlation with PHF2 levels in colorectal cancer. The oligonucleotide sequences used for cloning, primers for subcloning and RT-qPCR, as well as patient demographics, are provided in the supplemental tables.

E N D
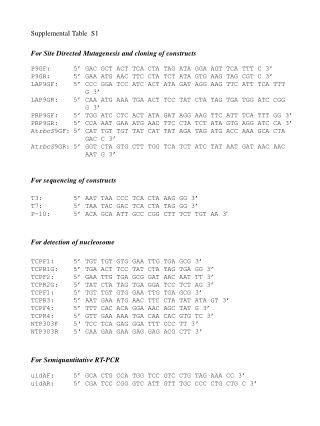
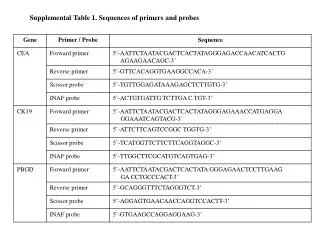
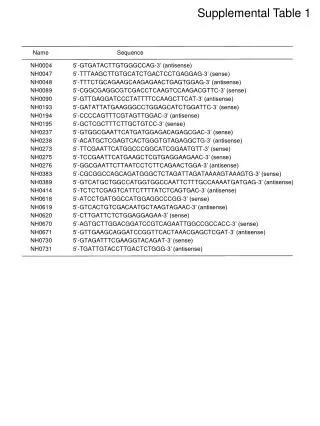
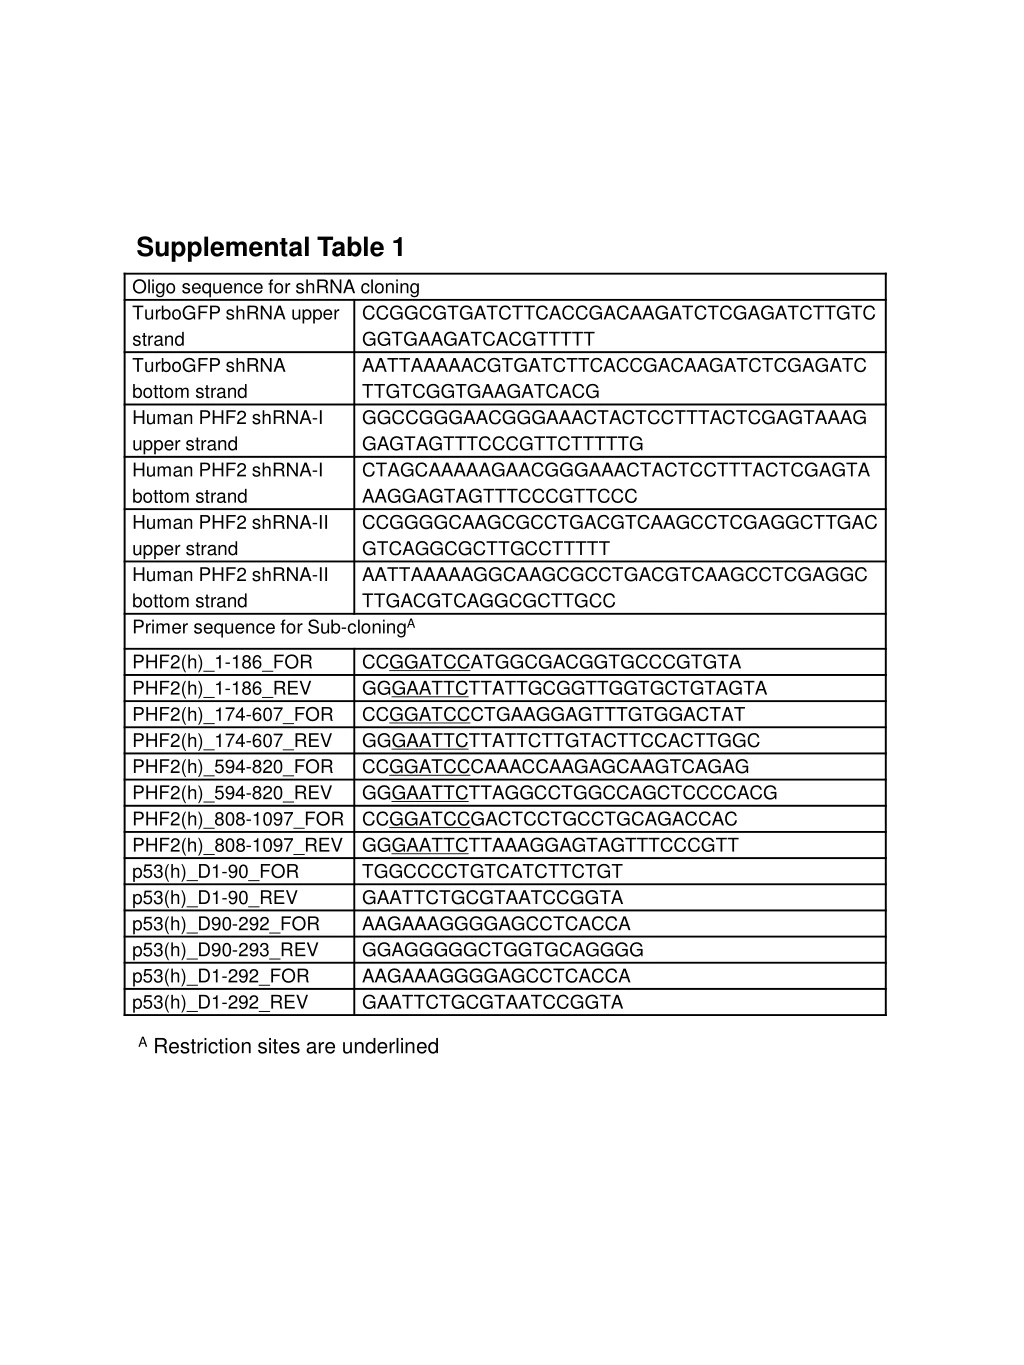
Supplemental Table 1 A Restriction sites are underlined
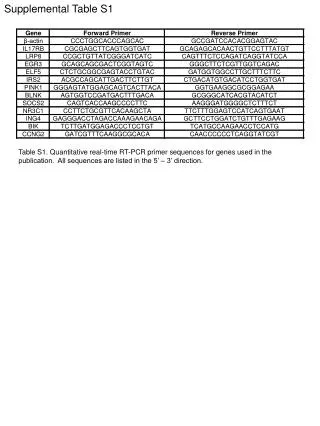
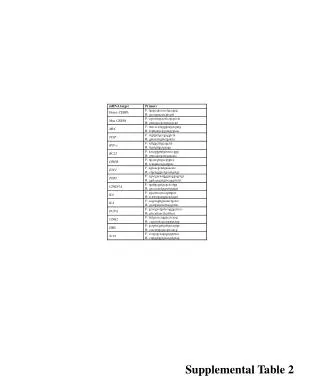
Supplemental Table 1 cont. Supplemental table 1. The oligonucleotide sequences used for cloning of shRNA viral vectors, primers for subcloning of plasmid vectors, and primers for RT-qPCR and Chip-PCR are listed.
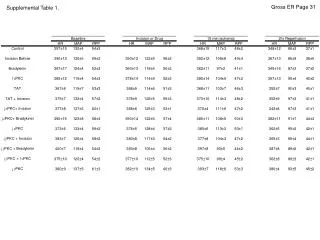
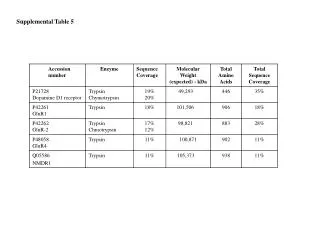
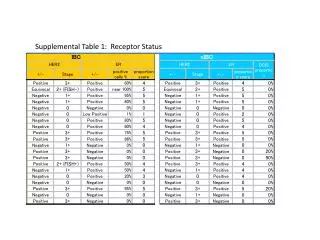
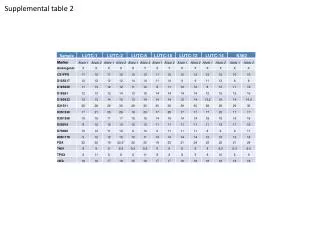
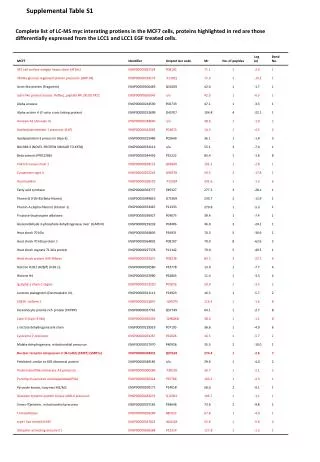
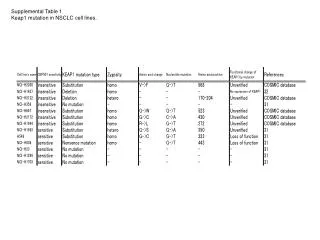
Supplemental Table 2 p53 functionality and p21 vs PHF2 levels in each tumor
Supplemental Table 2 cont. p53 functionality and p21 vs PHF2 levels in each tumor Supplemental table 2. The p53 cDNA was sequenced in 30 colorectal cancer tissues. According to functional status of p53, the cancer tissues are divided into two groups, active p53 and mutant p53. PHF2 and p21 levels shown in Figure 6a are listed together.
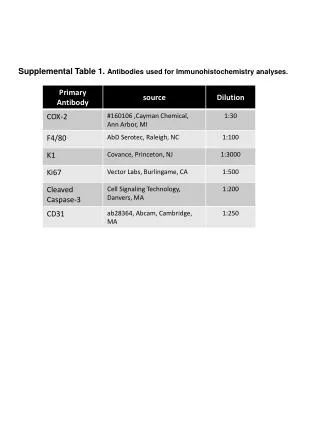
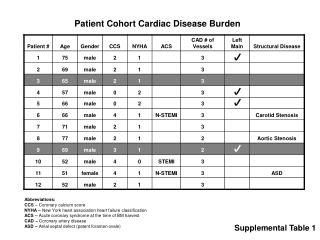
Supplemental Table 3 Patient Demographics for colon cancer tissue array
Supplemental Table 3 cont. Patient Demographics for stomach cancer tissue array
Supplemental Table 3 cont. Patient Demographics for stomach cancer tissue array Supplemental table 3. Demographic information on patients, stages and differentiation degree in colon and stomach cancer arrays used for Figure 6e-h is listed.
Supplemental Fig. 1 PBS Oxa 5-FU DOX PBS Oxa 5-FU DOX C. PARP C. PARP HepG2 Hep3B C. Casp 3 C. Casp 3 C. Casp 9 C. Casp 9 Tubulin Tubulin PBS Oxa 5-FU DOX PBS Oxa 5-FU DOX C. PARP C. PARP C. Casp 3 KATO III C. Casp 3 MKN-74 C. Casp 9 C. Casp 9 Tubulin Tubulin PBS Oxa 5-FU DOX PBS Oxa 5-FU DOX C. PARP C. PARP MCF7 C. Casp 3 MDA-MB231 C. Casp 3 C. Casp 9 C. Casp 9 Tubulin Tubulin Figure S1. Indicated stable cells were treated with PBS, 12.5 mM oxaliplatin, 50 mM 5-FU or 0.5 mM doxorubicin for 16 hours and apoptotic markers were analyzed by Western blotting using indicated antibodies.
Supplemental Fig. 2 H3K4-Me2 H3K9-Me2 H3K27-Me2 H3K36-Me2 H3K72-Me2 Total H3 Figure S2. Histone methylation status in PHF2 knock down cell lines was measured. Protein extract from HCT116 stable cells underwent western blotting with methyl-specific antibodies. .
Supplemental Fig. 3 PBS Oxa Sh-Con Sh-PHF2 Figure S3. Xenograft tumor sizes after PBS or Oxaliplatin (Oxa) treatment.