Download
1 / 9
90 likes | 117 Vues
This experiment involves observing oxygen bubbles released as Cabomba plant undergoes photosynthesis to determine the photosynthesis rate. By altering light intensity, investigate if bubbling rate varies. Follow precise steps to set up experiment, collect data, and analyze results to understand the relationship between light intensity and photosynthesis rate. Explore controlled variables, graph patterns, and interpret unexpected results to enhance experimental design and reliability. Predict impact of increasing light bulb power on bubble production.

E N D
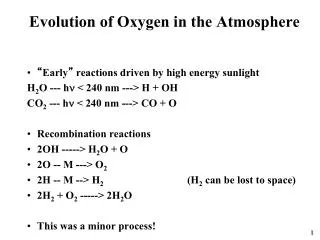
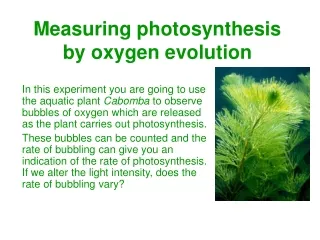
Measuring photosynthesis by oxygen evolution In this experiment you are going to use the aquatic plant Cabomba to observe bubbles of oxygen which are released as the plant carries out photosynthesis. These bubbles can be counted and the rate of bubbling can give you an indication of the rate of photosynthesis. If we alter the light intensity, does the rate of bubbling vary?
Cup your hand around the Cabomba sprig and gently flatten the fronds against the central stem
Carefully lower the flattened Cabomba into measuring cylinder, apex lowermost, and hold the end of the stem against the glass with your finger.
Fill the measuring cylinder with a 1% sodium hydrogen carbonate solution.
Cut the stem of the Cabomba sprig at an angle under the surface of the liquid. This cut end must remain in the liquid or an air lock may form. You should be able to observe bubbles of gas rising from the cut.
Place your Cabomba in front of a bright light source and let the plant equilibrate for five minutes. • Count the bubbles produced in 30 seconds. Repeat the reading twice more and record your results in a table. • Move the measuring cylinder so that it is different distances from the light source and repeat the experiment until you have enough results to show a pattern.
What are the input, outcome and controlled variables in this experiment? • Describe the pattern shown by your graph. • What is the relationship between the variables? • Can you explain the pattern shown by the graph using your understanding of photosynthesis? • Is the pattern shown in your graph what you expected or were some of your results unexpected? • If you had any unexpected results, were they a ‘one off’ (a random error) or did all the repeats give the same result? (This gives you an indication of how reliable your results were).
Were there any ways you could have improved your experiment? Were they all the same size bubbles? Could you think of a way of measuring the volume of gas given off? • Predict what would happen to the number of bubbles if you increased the power of the light bulb.