Lake Tahoe TMDL
200 likes | 428 Vues
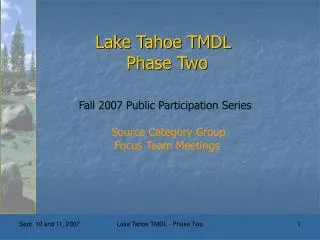
Lake Tahoe TMDL. Lake Tahoe TMDL. Phase Two. Phase Two. Fall 2007 Public Participation Series. Source Category Group. Focus Team Meetings. TMDL Program Overview. A science-based plan to restore Lake Tahoe’s clarity. Central TMDL Questions Questions Addressed

Lake Tahoe TMDL
E N D
Presentation Transcript
Lake Tahoe TMDL Lake Tahoe TMDL Phase Two Phase Two Fall 2007 Public Participation Series Source Category Group Focus Team Meetings Lake Tahoe TMDL - Phase Two
TMDL Program Overview A science-based plan to restore Lake Tahoe’s clarity Lake Tahoe TMDL - Phase Two
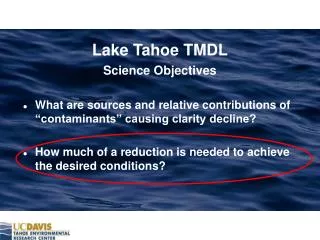
Central TMDL Questions Questions Addressed • What pollutants are causing Lake Tahoe’s clarity loss? • How much of each pollutant is reaching Lake Tahoe? • How much of each pollutant can Lake Tahoe accept and still achieve the clarity goal? Current Questions • What are the options for reducing pollutant inputs to Lake Tahoe? • What strategy should we implement to reduce pollutant inputs to Lake Tahoe? Lake Tahoe TMDL - Phase Two
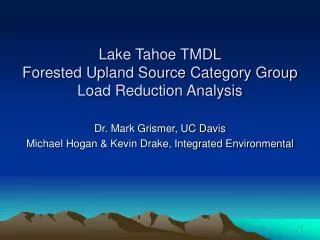
Source Category Group AnalysisOpportunities • Basin-Wide load reduction estimates • Relative load reduction opportunity among source categories • Consistent methods to evaluate future pollutant control options Lake Tahoe TMDL - Phase Two
Source Category Group Analysis Boundaries • Not suited to project scale • Evaluated pollutant control options chosen for data availability • Limited time, resources, and effectiveness data Lake Tahoe TMDL - Phase Two
Continuous Improvement • Adaptive management process • SNPLMA science funding opportunities • Each group identified “next steps” and data needs Lake Tahoe TMDL - Phase Two
Focus Team Role • Gain technical understanding of SCG approach • Act as a liaison to your agency • Provide input on preferred pollutant control options • Suggestions for future work Lake Tahoe TMDL - Phase Two
Questions? Lake Tahoe TMDL - Phase Two
Questions AddressedWhat is causing Lake Tahoe’s clarity loss? • Suspended fine sediment • Floating algae – fed by nutrients • Very fine sediment (<20 microns) accounts for ~2/3 of the clarity conditions Lake Tahoe TMDL - Phase Two
How much of each pollutant is reaching Lake Tahoe? Lake Tahoe TMDL - Phase Two
How much of each pollutant is reaching Lake Tahoe? Lake Tahoe TMDL - Phase Two
How much of each pollutant is reaching Lake Tahoe? Lake Tahoe TMDL - Phase Two
How much of each pollutant can Lake Tahoe accept and still achieve the clarity goal? • The Lake Clarity Model provides estimates of clarity response to load reductions • Reducing fines has a greater potential to improve clarity • Model output indicates significant reductions will be needed Lake Tahoe TMDL - Phase Two
What are the options for reducing pollutant inputs to Lake Tahoe? Good Question! Lake Tahoe TMDL - Phase Two
Approach to Answering Current Questions • Identify load reduction options • Quantify load reduction options • Prepare Integrated Strategies • Gather stakeholder input Lake Tahoe TMDL - Phase Two
Pollutant Load Reduction Opportunity Project - People • Source Category Groups • Technical Reviewers • Source Category Integration Committee • Project Team • Focus Teams Lake Tahoe TMDL - Phase Two
C B A A C B A Cost-Effectiveness Table O & M Cost Table Total 20 Year Cost Table Capital Cost Table Pollutant Reduction Opportunity Development Process Step 1: PCO Evaluation Step 2: Site-Scale Analysis Tier 1 Tier 2 Tier 3 PCO Grouping Process TreatmentTiers Settings PCO Concepts PCO Concepts Screening Process Screening Process Viable PCOs • Extrapolation Process • GIS • Models Step 3: Basin-Wide Analysis Nitrogen Reduction Table Sediment Reduction Table Phosphorus Reduction Table Load Tables Combined Results Tables Cost Tables
C B A A C B A Cost-Effectiveness Table O & M Cost Table Total 20 Year Cost Table Capital Cost Table Pollutant Reduction Opportunity Development Process Step 1: PCO Evaluation Step 2: Site-Scale Analysis Tier 1 Tier 2 Tier 3 PCO Grouping Process TreatmentTiers Settings PCO Concepts PCO Concepts Screening Process Screening Process Viable PCOs • Extrapolation Process • GIS • Models Step 3: Basin-Wide Analysis Nitrogen Reduction Table Sediment Reduction Table Phosphorus Reduction Table Load Tables Combined Results Tables Cost Tables
C B A A C B A Cost-Effectiveness Table O & M Cost Table Total 20 Year Cost Table Capital Cost Table Pollutant Reduction Opportunity Development Process Step 1: PCO Evaluation Step 2: Site-Scale Analysis Tier 1 Tier 2 Tier 3 PCO Grouping Process TreatmentTiers Settings PCO Concepts PCO Concepts Screening Process Screening Process Viable PCOs • Extrapolation Process • GIS • Models Step 3: Basin-Wide Analysis Nitrogen Reduction Table Sediment Reduction Table Phosphorus Reduction Table Load Tables Combined Results Tables Cost Tables
Development Summary • PCO Selection and Evaluation • Site Scale Analysis • Settings • Tiers • Basin-wide extrapolation Lake Tahoe TMDL - Phase Two