Download
1 / 27
270 likes | 373 Vues
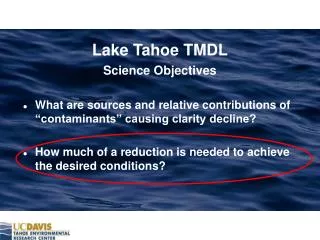
Lake Tahoe TMDL Forested Upland Source Category Group Load Reduction Analysis. Dr. Mark Grismer, UC Davis Michael Hogan & Kevin Drake, Integrated Environmental. Introduction to Forested Uplands in the Lake Tahoe Basin. Represents ~80% of land area in Tahoe Basin

E N D
Lake Tahoe TMDLForested Upland Source Category GroupLoad Reduction Analysis Dr. Mark Grismer, UC Davis Michael Hogan & Kevin Drake, Integrated Environmental
Introduction to Forested Uplands in the Lake Tahoe Basin • Represents ~80% of land area in Tahoe Basin • Diverse array of habitat types, soil types and landscape features • Many land-uses and activities including ski resorts, unpaved roads, “undisturbed” forest, campgrounds, thinning and fuel reduction activities, hiking, biking, wilderness areas, roadless areas, etc.
Pollutant Reduction Opportunity Development Process Step 1: PCO Evaluation Step 2: Site-Scale Analysis C B Tier 1 A Tier 2 A Tier 3 C PCO Grouping Process TreatmentTiers B Settings Screening Process PCO Concepts Viable PCOs A • Extrapolation Process • GIS • Models Step 3: Basin-Wide Analysis Nitrogen Reduction Table Sediment Reduction Table Phosphorus Reduction Table Load Tables Combined Results Tables Cost Tables Total 20 Year Cost Table Capital Cost Table O & M Cost Table Cost-Effectiveness Table
Pollutant Reduction Opportunity Development Process Step 1: PCO Evaluation Step 2: Site-Scale Analysis C B Tier 1 A Tier 2 A Tier 3 C PCO Grouping Process TreatmentTiers B Settings Screening Process PCO Concepts Viable PCOs A • Extrapolation Process • GIS • Models Step 3: Basin-Wide Analysis Nitrogen Reduction Table Sediment Reduction Table Phosphorus Reduction Table Load Tables Combined Results Tables Cost Tables Total 20 Year Cost Table Capital Cost Table O & M Cost Table Cost-Effectiveness Table
Developing Settings • Used LSPC model land-use categories as building blocks • Coordinated with UGSCG to delineate “forested” from “urban” land-uses • Grouped land-use categories into settings based on functional condition and PCO application
Developing Treatment Tiers • Tiers represent incremental improvements in soil cover and functional condition • Tier 1—Standard treatments used in current practice. • Tier 2—State-of-the-art practices designed to achieve functional rehabilitation of hydrologic properties. • Tier 3—Treatments designed to develop site conditions that will eventually mimic undisturbed, natural conditions.
Setting B Treatment Tiers * Treatment Tier 3 is not achievable for the Veg_unimpacted EP5 land-use category
Setting C Treatment Tiers Required BMPs – waterbar/mulch skid trails, landings and temporary roads; close temporary roads. Full BMPs – till, mulch and construct water bars on all skid trails; obliterate/recontour (i.e. full functional restoration) all landings and temporary roads.
Pollutant Reduction Opportunity Development Process Step 1: PCO Evaluation Step 2: Site-Scale Analysis C B Tier 1 A Tier 2 A Tier 3 C PCO Grouping Process TreatmentTiers B Settings Screening Process PCO Concepts Viable PCOs A • Extrapolation Process • GIS • Models Step 3: Basin-Wide Analysis Nitrogen Reduction Table Sediment Reduction Table Phosphorus Reduction Table Load Tables Combined Results Tables Cost Tables Total 20 Year Cost Table Capital Cost Table O & M Cost Table Cost-Effectiveness Table
Merging Settings, Treatment Tiers and Functional Condition Classes
Basin-wide Loading Analysis Process • Get LSPC model data for all 184 sub-watersheds. Assume basic hydrologic processes are in effect • Determine baseline loading for each sub-watershed from FUSCG regression equations. • Estimate and optimize scaling factor for each sub-watershed such that predicted sub-WS sediment loading is equivalent to that from LSPC. • Calculate loading for each setting – treatment tier combination based on soil functional condition classes and corresponding regression equations. • Sum loading for each setting across each sub-watershed then sum results from each sub-watershed across the Basin.
Basin-wide Cost Analysis Process • Obtain cost information from field practitioners, Basin agencies, forestry contractors, ski resort operations managers and FUSCG’s contracting experience. • Assume full treatment costs best reflected by private contractor rates • Estimate functional life expectancy of each treatment based on observed and measured performance in the field, local agency estimates, FUSCG experience and best professional judgment. • Estimate costs for each setting-treatment tier combo then sum for the total area (acres) of each setting across Basin to derive Basin-wide total cost and cost per acre estimates.
Basin-wide Load Reduction Matrix Setting A – Unpaved Roads – 310.8 acres
Basin-wide Load Reduction Matrix Setting B – Ski Runs, Recreation Areas – 1877.9 acres
Basin-wide Load Reduction Matrix Setting C – Forested Areas – 162,639 acres
Change in Annual Loading Reduction Per Acre for Different Treatment Tiers
Key Findings • Greatest load reductions per acre are associated with disturbed volcanic soils on the north and west sides of the Basin, such as unpaved roads, recreational and ski run areas (Settings A and B). • Per acre load reductions from forested areas are an order of magnitude smaller than per acre reductions from unpaved roads, ski slopes and campgrounds. • Annual per acre fine sediment loading rates from unpaved roads are roughly double that from ski trails and 20–40 times greater than loading rates from undeveloped forested areas. • In forested areas, obliteration of legacy areas has the greatest potential to efficiently reduce loading, especially if conducted in combination with planned thinning and fuels reduction treatments.