Download
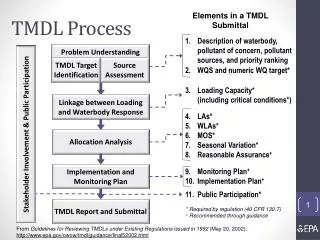
1 / 17
170 likes | 318 Vues
Golden Lake TMDL Critique. Mayank Gupta & Karla Bussen. Golden Lake Description. Shallow Lake 57.2 acres; max depth=24 ft; mean depth= 8ft 90% littoral (<15ft) Lakeshore is well developed Class 2B: supports aquatic and recreation uses warm & cool fisheries, swimming, non-motorized boating

E N D
Golden Lake TMDL Critique Mayank Gupta & Karla Bussen
Golden Lake Description • Shallow Lake • 57.2 acres; max depth=24 ft; mean depth= 8ft • 90% littoral (<15ft) • Lakeshore is well developed • Class 2B: supports aquatic and recreation uses • warm & cool fisheries, swimming, non-motorized boating • Naturally brown tinted water due to tannin
Watershed Description • West-central Portion of the Rice Creek Watershed District (RCWD) • Sub-watershed of Upper Mississippi Watershed • Main tributary is Anoka County Ditch 53-62. • 6,426 acres drain to lake through the ditch and 139 acres directly drain into the lake
303d: Impaired Water • 1st listed in 2002 as an impaired water • Aquatic recreation standards not met due to excess nutrients/eutrophication • Targeted start/completion years: 2004/2008 (September 30,2009) • 5C – Impaired by one pollutant and no TMDL study plan is approved by EPA
Sources of Phosphorous • 40% Watershed • MS4s • 14% failing septic systems • 57% Internal Loading • anoxic conditions • physical disturbance (bottom- feeding fish and wind) • curlyleaf pondweed • 3% atmosphere
Models and Methods • Model used: BATHTUB
Pollution Reduction Plans Reductions designed to meet W.Q. standards from June-Sept. (growing season)
Implementation Plan Reduce total Phosphorous load in the watershed and improve in-lake water clarity.
How will this be achieved? • Regulation • management rules • Education • storm water article in city paper each month • full-time environmental education coordinator • Public Advisory Commitee • Incentives • BMPs, shoreline restoration, native landscaping, lakeshore buffers