1 / 4

Optimal RX Thresholds for B6: RAL Data Analysis of RXmin vs VCSEL Power

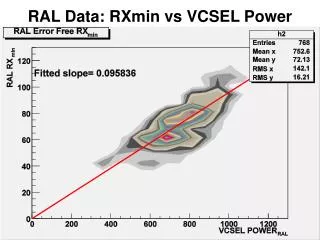
This document presents a detailed analysis of optimal RX values using RAL data, focusing specifically on RXmin as compared to VCSEL power levels in the B6 context. By systematically evaluating the data, we can determine the optimal RX thresholds and assess the distribution of links that are 20 DAC counts away from either RXmin or RXmax for given DAC values. This analysis is crucial for enhancing performance and reliability in optical communications.

Télécharger la présentation

Optimal RX Thresholds for B6: RAL Data Analysis of RXmin vs VCSEL Power

An Image/Link below is provided (as is) to download presentation Download Policy: Content on the Website is provided to you AS IS for your information and personal use and may not be sold / licensed / shared on other websites without getting consent from its author. Content is provided to you AS IS for your information and personal use only. Download presentation by click this link. While downloading, if for some reason you are not able to download a presentation, the publisher may have deleted the file from their server. During download, if you can't get a presentation, the file might be deleted by the publisher.

E N D

Presentation Transcript


  1. RAL Data: RXmin vs VCSEL Power

  2. Oxford RXmin vs VCSEL Power

  3. RXmin Oxford vs RAL

  4. Optimal RX Thresholds for B6 • Use RAL data to determine optimal RX values • For a given DAC value count how many links are 20 DAC counts away from RXmin or RXmax.

More Related