Download
1 / 77
820 likes | 905 Vues
Learn about IR spectroscopy to study molecular vibrations, bond types, and diagnostic regions of the electromagnetic spectrum. Discover how wavenumbers indicate bond characteristics and explore signal peaks in IR spectra.

E N D
Organic Chemistry Third Edition David Klein Chapter 14 Infrared Spectroscopy and Mass Spectrometry
14.1 Introduction to Spectroscopy • Spectroscopy involves an interaction between matter and light (electromagnetic radiation) • Light can be thought of as waves of energy or packets (particles) of energy called photons • Properties of light waves include wavelength and frequency • Wavelengthis inversely proportional to energy • Frequencyis directly proportional to energy
14.1 Introduction to Spectroscopy • Electromagnetic spectrum: The range of possible frequencies of light.
14.1 Introduction to Spectroscopy • Different regions of the electromagnetic spectrum are used to probe for different aspects of molecular structure:
14.1 Introduction to Spectroscopy • Matter exhibits particle-like properties • On the macroscopic scale, matter appears to exhibit continuous behavior rather than quantum behavior • Consider the example of an engine powering the rotation of a tire. The tire should be able to rotate at nearly any rate • Matter also exhibits wave-like properties • Matter on the molecular scaleexhibits quantum behavior • A molecule will only rotate or vibrate at certain rates (energies)
14.1 Introduction to Spectroscopy • For the electrons in covalent bonds, vibrational energy levels are separated by gaps (quantized) • If a photon of light strikes the molecule with the exact amount of energy needed, the light is absorbed, and vibrational excitation will occur • Infrared (IR) Light generally causes molecular vibration. Different types of bonds absorb different IR energies. • Eventually, the absorbed energy is released from the molecule as heat
14.2 IR Spectroscopy • Molecular bonds can vibrate by stretching or by bending in a number of ways • This chapter will focus mainly on stretching frequencies
14.2 IR Spectroscopy • Some night vision goggles can detect IR light that is emitted • IR or thermal imaging is also used to detect breast cancer
14.2 IR Spectroscopy • The energy necessary to cause vibration depends on the type of bond
14.2 IR Spectroscopy • An IR spectrophotometer irradiates a sample with all frequencies of IR light • The frequencies absorbed by the sample tell us the types of bonds (functional groups) that are present • Most commonly, samples are deposited on a salt (NaCl) plate. • Alternatively, the compound may be dissolved in a solvent or embedded in a KBr pellet
14.2 IR Spectroscopy • An IR absorption spectrum plots the % transmittance as a function of frequency. The “peaks” are called absorption bands
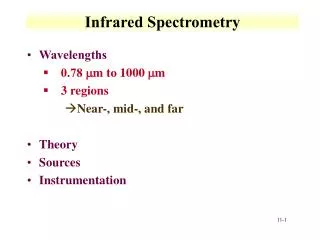
14.2 IR Spectroscopy • Units of frequency in IR are called wavenumbers • The values range from 400 to 4000 cm-1
14.2 IR Spectroscopy • A signal (peak) on the IR spectrum has three important characteristics: wavenumber, intensity, and shape
14.3 Signal Characteristics: Wavenumber • The frequency (wavenumber) for a stretching vibration depends on (1) bond strength and (2) mass difference of the atoms bonded together • Stronger bond = higher stretching frequency • Larger mass difference = higher stretching frequency
14.3 Signal Characteristics: Wavenumber • The trends in stretching frequency of given bonds can be rationalized based on bond strength and mass difference
14.3 Signal Characteristics: Wavenumber • The wavenumber formula and empirical observations allow us to designate regions as representing specific types of bonds
14.3 Signal Characteristics: Wavenumber • The region above 1500 cm-1is called the diagnostic region. The peaks in this region provide clear information • The region below 1500 cm-1is called the fingerprint region. There are typical many signals here and it is difficult to analyze
14.3 Signal Characteristics: Wavenumber • Because the have the same types of covalent bonds, the IR spectra for 2-butanol and 2-propanol are virtually indistinguishable.
14.3 Signal Characteristics: Wavenumber • Compare the IR stretching frequencies for each C-H bond below: • The higher the s character of the carbon, the stronger the C-H bond, and so the higher the stretching frequency of the C-H bond.
14.3 Signal Characteristics: Wavenumber • Alkyl C-H bonds come just under 3000 cm-1, while alkenyl and alkynyl C-H bonds are over 3000 cm-1
14.3 Signal Characteristics: Wavenumber • It is possible that an alkene or alkyne could give an IR spectra without any signals above 3000 cm-1
14.3 Signal Characteristics: Wavenumber • Resonance delocalization of electrons affects the strength of a covalent bond, and thus the wavenumber of a stretching signal • Consider the C=O stretching value for the following compounds:
14.3 Signal Characteristics: Wavenumber • The more delocalized the p electrons, the weaker the p bond, and the lower the stretching frequency
14.3 Signal Characteristics: Wavenumber • Practice with Conceptual Checkpoints 14.1 – 14.4 • Conjugated carbonyls have lower stretching frequencies
14.4 Signal Characteristics: Intensity • The strength (intensity) of IR signals can vary
14.4 Signal Characteristics: Intensity • When a bond undergoes a stretching vibration, its dipole moment also oscillates • Recall the formula for dipole moment includes the distance between the partial charges, • The oscillating dipole moment creates an electrical field surrounding the bond
14.4 Signal Characteristics: Intensity • The more polar the bond, the greater the opportunity for interaction between the waves of the electrical field and the IR radiation • Greater bond polarity = stronger IR signals
14.4 Signal Characteristics: Intensity • Note the general strength of the C=O stretching signal vs. the C=C stretching signal
14.4 Signal Characteristics: Intensity • If a bond is completely symmetrical, then a stretching frequency is not observed in the IR spectrum:
14.4 Signal Characteristics: Intensity • Stronger signals are also observed when there are multiple bonds of the same type vibrating • Although C-H bonds are not very polar, they often give very strong signals, because there are often many of them in an organic compound • Because sample concentration can affect signal strength, the Intoxilyzer 5000 can be used to determine blood alcohol levels be analyzing the strength of C-H bond stretching in blood samples • Practice with conceptual checkpoints 14.5 – 14.7
14.5 Signal Characteristics: Shape • Some IR signals are broad, while others are very narrow • O-H stretching signals are often quite broad
14.5 Signal Characteristics: Shape • When possible, O-H bonds form H-bonds that weaken the O-H bond strength • The H-bonds are transient, so the sample will contain molecules with varying O-H bond strengths • But, the O-H stretch signal will be narrow if a dilute solution of an alcohol is prepared in a solvent incapable of H-bonding
14.5 Signal Characteristics: Shape • Its possible to see two signals for an O-H bond, one for the “free” OH and one for those engaged in H-bonding. • Practice with Conceptual Checkpoint 14.8
14.5 Signal Characteristics: Shape • Consider how broad the O-H stretch is for a carboxylic acid and how its wavenumber is around 3000 cm-1 rather than 3400 cm-1 for a typical O-H stretch
14.5 Signal Characteristics: Shape • H-bonding is often more pronounced in carboxylic acids, because they can forms H-bonding dimers • Practice with Conceptual Checkpoint 14.9
14.5 Signal Characteristics: Shape • For the molecule below, predict all of the stretching signals in the diagnostic region • O-H stretch (broad peak at roughly 3200) • C-H stretch (just above 3000) sp2 • C-H stretch (just below 3000) sp3 • C=O stretch (around 1700) • C=C stretch (weaker signal around 1500-1600)
14.5 Signal Characteristics: Shape • Primary and secondary amines exhibit N-H stretching signals. • Because N-H bonds are capable of H-bonding, their stretching signals are often broadened • 1˚ amines exhibit two signals for the N-H bonds • 2˚ amines exhibit only one signal for N-H bond • See example spectra on next slide
14.5 Signal Characteristics: Shape • The two N-H bonds vibrate together in two different ways • At any point in time, half the molecules are stretching one way, the rest stretching the other way, giving rise to a total of two signals • Practice with Conceptual Checkpoint 14.10
14.6 Analyzing an IR Spectrum • Table 14.2 summarizes some of the key signals that help us to identify functional groups present in molecules • Often, the molecular structure can be identified from an IR spectra • Focus on the diagnostic region (above 1500 cm-1) • 1600-1850 cm-1 – check for double bonds • 2100-2300 cm-1 – check for triple bonds • 2700-4000 cm-1 – check for X-H bonds • Analyze wavenumber, intensity, and shape for each signal
14.6 Analyzing an IR Spectrum • Often, the molecular structure can be identified from an IR spectra • When looking at the 2700-4000 cm-1 (X-H) region, draw a line at 3000, and focus on the signals that come above it. • Practice with SkillBuilder 14.1
14.7 Using IR to Distinguish Between Two Compounds • As we have learned in previous chapters, organic chemists often carry out reactions to convert one functional group into another • IR spectroscopy can often be used to determine the success of such reactions • For the reaction below, we could look for the absence of an O-H signal to confirm the starting material has been consumed • Practice with SkillBuilder 15.2
14.7 Using IR to Distinguish Between Two Compounds • For the reactions below, identify the key functional groups, and describe how IR data could be used to verify the formation of product • Is IR analysis qualitative or quantitative?
14.8 Introduction to Mass Spectrometry • Mass spectrometry is primarily used to determine the molar mass and formula for a compound • In a mass spectrometer: • A compound is vaporized, then ionized, and undergoes fragmentation • The masses of the ions are detected and graphed
14.8 Introduction to Mass Spectrometry • The most common method of ionizing molecules is by electron impact (EI) • The sample is bombarded with a beam of high energy electrons (1600 kcal or 70 eV) • EI usually causes an electron to be ejected from the molecule.
14.8 Introduction to Mass Spectrometry • The mass of the radical cationis the same as the parent compound (mass of an electron is negligible) • If the radical cation remains intact, it is known as the molecular ion (M+•) or parent ion
14.8 Introduction to Mass Spectrometry • Most of the radical cations (parent ions) typically fragment into a radical and a cation: • The ions are deflected by a magnetic field, and their mass-to-chargeratio (m/z) is detected. • Neutrally charged fragments are not detected.
14.8 Introduction to Mass Spectrometry • the mass spectrum shows the relative abundance of each cation that was detected • The base peak is the tallest peak in the spectrum, and is the most abundant fragment • For methane the base peak is the parent ion, M+•
14.8 Introduction to Mass Spectrometry • Peaks with a m/z less than M+• represent fragments • Subsequent H radicals can be fragmented to give the ions with a mass/charge = 12, 13 and 14
14.8 Introduction to Mass Spectrometry • Mass spec is a relatively sensitive analytical method • Many organic compounds can be identified • Pharmaceutical: drug discovery and drug metabolism, reaction monitoring • Biotech: amino acid sequencing, analysis of macromolecules • Clinical: neonatal screening, hemoglobin analysis • Environmental: drug testing, water quality, food contamination testing • Geological: evaluating oil composition • Forensic: Explosive detection • Many More