Versatile Applications of Modern Infrared Spectrometry for Molecular Analysis
180 likes | 216 Vues
Explore the diverse applications of infrared spectrometry, including qualitative and quantitative analyses of various molecular species in solid, liquid, and gaseous samples. Learn about near-infrared, mid-infrared, and far-infrared measurement techniques, along with sample preparation methods such as solutions, liquid cells, pellets, and mulls. Discover the significance of absorption, reflectance, and emission measurements in different spectral regions. Dive into the instrumental analysis of infrared spectra for structural determination in organic and biochemical compounds. Enhance your understanding of infrared spectroscopy with insightful details on instrument configurations and sample handling techniques.

Versatile Applications of Modern Infrared Spectrometry for Molecular Analysis
E N D
Presentation Transcript
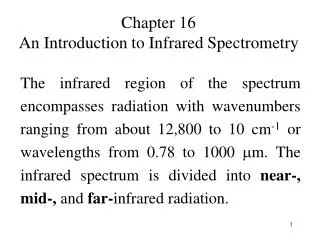
Infrared Spectrometry Instrumental Analysis Chapter 17
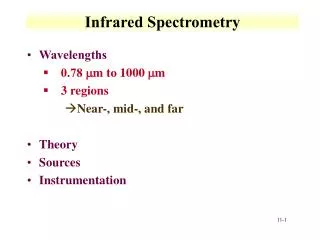
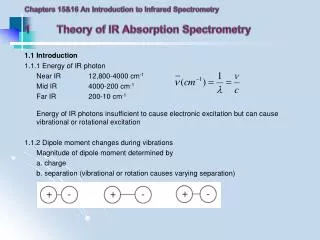
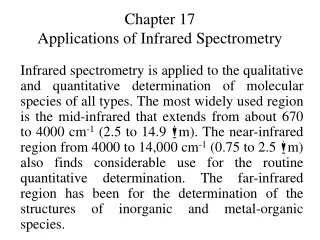
Applications of Infrared Spectrometry • Modern infrared spectrometry is a versatile tool that is applied to the qualitative and quantitative determination of molecular species of all types. The applications of infrared spectrometry can be split into three main areas: Near-infrared – 4,000 to 14,000 cm-1 Mid-infrared – 670 to 4,000 cm-1 Far- infrared – less than 670 cm-1
Spectral Regions Type Measurement Type Analysis Type Samples Near-infrared Diffuse Reflectance Absorption Quantitative Quantitative Solid, Liquid Gaseous Mixtures Mid-infrared Absorption Reflectance Emission Qualitative Quantitative Chromatographic Qualitative Quantitative Solid, liquid, gas Solid, liquid, gas Solid, liquid, gas Pure solid or liquid Atmospheric sample Far-infrared Absorption Qualitative Pure inorganic or metal organic Chart on Regions
Gas in an Evacuated Cylinder • The spectrum of a low-boiling liquid or gas can be obtained by permitting the sample to expand into an evacuated cylindrical cell equipped with suitable windows. A variety of cylindrical cells are available with path lengths that that range from a couple of centimeters to 10 meters or more. • The longer the path lengths are obtained in compact cells by providing reflecting internal surfaces, so that the beam makes numerous passes through the sample before exiting the cell.
Solutions • When feasible, a convenient way of obtaining infrared spectra is on solutions prepared to contain a known concentration of sample, as is generally done in ultraviolet/visible spectroscopy. • This technique is limited due to the availability of solvents that are transparent over significant regions in the infrared.
Dissolved in Solvents • There is no particular solvent that is completely transparent in the entire mid-infrared region. Therefore solvents are chosen on the basis of the region the sample will absorb. • Water and alcohol are used seldom because they absorb strongly and they attack alkali metal halides, the most common materials used for cell windows. The alkali metals are the most common metals used in cell windows.
Liquid in Cell • Because of the tendency for solvents to absorb, infrared cells are ordinarily much narrower than those employed in the UV/Vis regions. Fixed path length cells can be filled or emptied with a hypodermic syringe. • Sodium Chloride windows are widely used because their surfaces. A common problem with sodium chloride cells is that they absorb moisture and become fogged. To get rid of the fogginess one has to polish the window with a buffing powder returns them to their original condition.
Demountable Liquid Cell • The cells are frequently demountable, with Teflon spacers to allow for variation in path length. • The thickness, b, of very narrow infrared cells can be determined. The maxima occur when the radiation reflected off of the two internal surfaces of the cell has traveled a distance that is an integral multiple, N, of the wavelength of the radiation that was transmitted with out reflection: 2b/N =
Pellets • One of the most popular techniques for handling solid samples has been KBr pelleting. In using this technique, a milligram or less of the finely ground sample is ultimately mixed with about 100 mg of dried potassium bromide powder. • Halide salts have the property of cold flow in which they have glass like transparent or translucent properties when sufficient pressure is applied to the finely powdered materials. With many compounds KBr pelleting produces excellent spectra that appear in many spectral libraries.
Pellets (cont) • The KBr pelleting system is designed to allow the spectroscopist to position a KBr die in the laboratory press without the need to continually connect or disconnect a vacuum tube from an external vacuum pump when samples are processed.
Mulls • Mulls are formed by grinding 2 to 5 mg of the finely powdered sample in the presence of one or two drops of a heavy hydrocarbon oil (Nujol). If hydrocarbon bands are likely to interfere, fluorolube, a halogenated polymer can be used instead. The disadvantage of Nujol is that hydrocarbon bands may interfere with analyte absorbances. A second method of forming a mull involves grinding the powdered analyte with dry potassium bromide and forming a disk. • The ratio of analyte to potassium bromide is usually about 1:100. The materials are ground together using a mortar and pestle or a small ball mill. The mixture is then pressed in a die at 10,000–15,000 psi to form a small transparent disk and analyzed. Care must be taken when preparing the disk to protect it from moisture. It is very common to see absorbencies for moisture when using potassium bromide disks.
Mid-Infrared Absorption Spectrometry • Mid-infrared absorption and reflection spectrometry are major tools for determining the structure of organic and biochemical species. Mid-infrared light (2.5 - 50 µm, 4000 - 200 cm-1 See Diagram Below) is energetic enough to excite molecular vibrations to higher energy levels. • The wavelength of many IR absorption bands are characteristic of specific types of chemical bonds, and IR spectroscopy finds its greatest utility for qualitative analysis of organic and organometallic molecules. IR spectroscopy is used to confirm the identity of a particular compound and as a tool to help determine the structure of a newly synthesized molecule (with NMR spectroscopy and mass spectrometry).
Absorption Spectrometry • The visible region of the electromagnetic spectrum consists of photons with wavelengths from approximately 400 to 700 nm. The short wavelength cutoff is due to absorption by the lens of the eye and the long wavelength cutoff is due to the decrease in sensitivity of the photoreceptors in the retina for longer wavelengths. Light at wavelengths longer than 700 nm can be seen if the light source is intense.
Type of Radiation Frequency Range (Hz) Wavelength Range Type of Transition gamma-rays 1020-1024 <1 pm nuclear X-rays 1017-1020 1 nm-1 pm inner electron ultraviolet 1015-1017 400 nm-1 nm outer electron visible 4-7.5x10¹⁴ 750 nm-400 nm outer electron near-infrared 1x10¹⁴-4x10¹⁴ 2.5 µm-750 nm outer electron molecular vibrations infrared 1013-1014 25 µm-2.5 µm molecular vibrations microwaves 3x10¹¹-1013 1 mm-25 µm molecular rotations, electron spin flips* radio waves <3x10¹¹ >1 mm nuclear spin flips* Electromagnetic Spectrum
Qualitative Analysis • The mid-infrared region is further broken down into the group frequency region (1,280 to 5,000 cm-1) and the fingerprint region (670 to 1,280 cm-1). Since most organic molecules have single bonds, the region below 1500 cm-1 can become quite complex and is often referred to as the 'fingerprint region'. • If you are dealing with an unknown molecule which has the same 'fingerprint' in this region, that is considered evidence that the two molecules may be identical. The fingerprint region is useful because small differences in the structure and constitution of a molecule result in significant changes in the appearance and distribution of absorption peaks in this region. A close match between two spectra in the fingerprint region constitutes almost certain evidence for the identity of the compounds yielding the spectra.
Quantitative Analysis • The use of highly concentrated solutions (not necessarily highly concentrated in the absorber). • Poor monochromaticity of the radiation beam. • "Stray light" within the instrument. • Changes in chemical speciation. • Quantitative infrared absorption methods differ somewhat from UV/VIS molecular spectroscopic methods because of the greater complexity of the spectra, the narrowness of the absorption bands, and the instrumental limitations of infrared instruments.
Quantitative Analysis • Even when there is full confidence that Beer's Law can be applied, there are random errors in absorbance measurements to be considered. Random instrumental errors arise primarily from electronic noise and, hence, vary somewhat with instrument design. • A useful rule of thumb for absorbance measurements is to keep measured A values within the range 0.5 - 1.0. Some modern instruments give optimum precision near A = 1.5 but it is always best to avoid measuring below A = 0.1 (small difference between large numbers) or above A = 2.0 (where only 1% of light is transmitted and stray light becomes important).
References • Chem Center - Powered by ACS • http://www.chemcenter/org • Science Magazine • http://www.sciencemag.org