Download
1 / 29
330 likes | 678 Vues
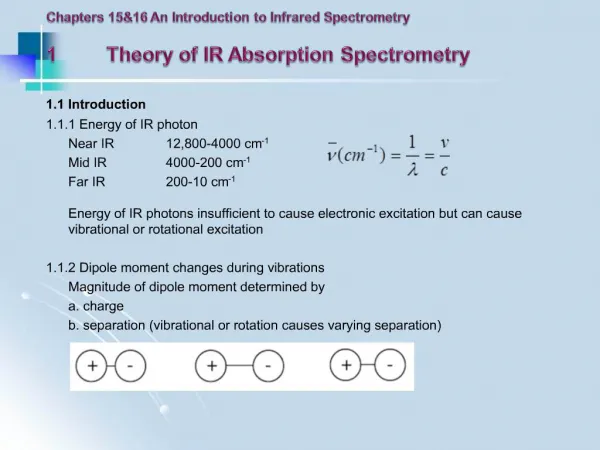
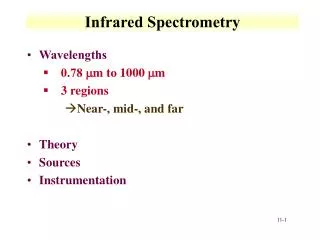
Introduction to Infrared Spectrometry Chap 16. Quantum Mechanical Treatment of Vibrations Required to include quantized nature of E From solving the wave equations of QM:. Selection rule for vib. transitions. Quantum Mechanical Treatment of Vibrations. Plot of potential energy:.

E N D
Quantum Mechanical Treatment of Vibrations • Required to include quantized nature of E • From solving the wave equations of QM: Selection rule for vib. transitions
Quantum Mechanical Treatment of Vibrations • Plot of potential energy: • where level spacings: hvres • All vib levels spaced • equally for HO only Interatomic distance, r →
Problems with Harmonic Oscillator (HO) Model • Real vib levels coalesce as v levels increase • Does not allow for dissociation of bond • Repulsion is steeper at small r • Appears as if atoms can pass through • each other during vibrational amplitude Solution: Anharmonic Oscillator (AHO)
Anharmonic Oscillator (AHO) Fig. 16-3
Anharmonic Oscillator (AHO) • Three consequences: • (1) Harmonic at low v levels • (2) ΔE becomes smaller at high v levels • (3) Selections rule fails: Δv = ±1 and ±2... • referred to as overtones
Vibrational Modes • Approach: • Each atom in a molecule can be located • with three coordinates (degrees of freedom) • A molecule with N atoms then has 3N DOF • Translational motion defined by center-of- • mass coordinates (COM)
Linear Molecules • 3 DOF to define translation • 2 DOF to define rotation • 3N – 5 ≡ number of vibrational modes • Nonlinear Molecules • 3 DOF to define translation • 3 DOF to define rotation • 3N – 6 ≡ number of vibrational modes
Examples N2 CO2 H2O CH3-C(O)-CH3
Vibrations of CO2 Fig 16-10 667 cm-1 2350 cm-1 } 1388 cm-1 Doubly degenerate No dipole change Dipole change Dipole change
Vibrations of H2O 3657 cm-1 1595 cm-1 3766 cm-1
IR Sources and Transducers Sources (1200 – 2200 K)
Spectral emission from a Nernst glower at ~ 2200 K Fig 16-16
IR Sources and Transducers Sources (1200 – 2200 K)
Transducers • IR beam 10-7 - 10-9 W, ΔT at transducer mK-µK
IR Instrumentation Dispersive Grating IR Instruments: Fig 16-11
IR Instrumentation • Dispersive Grating IR Instruments: • Similar to UV-Vis spectrophotometer • BUT sample after source and before monochromator in IR • Sample after monochromator in UV- Vis - less incident light • Grating 10-500 blazes per mm • Single beam and double beam (DB in time and space) • DB eliminates atmospheric gas interference
Single- and Double-Beam Spectra of the Atmosphere Fig. 16-9
Fourier Transform IR Instruments: • FTIR has largely displaced dispersive IRs • A multiplex instrument (e.g., diode array) • Beam is split and pathlength is varied to produce interference patterns • Signal converted from frequency domain to time domain • Fourier transform then converts “clean” signal back to frequency domain
Fourier Transform Instruments (Section 7-I)have two advantages: • Throughput (or Jaquinot) advantage • Few optics, no slits, high intensity • Usually, to improve resolution, decrease slit width but less light makes spectrum "noisier" • i.e., signal-to-noise ratio (S/N) decreases (p. 110-111):
S/N improves with more scans (noise is random, signal is not!) Fig. 5-10
(2) Multiplex (or Fellget) advantage • Simultaneously measure entire spectrum Components of Fourier Transform Instruments • Based on Michelson Interferometer • Converts frequency signal to time signal
Fig. 7-41 (p 207) Time domain Frequency domain
Time Domain Signal of a Source Made Up of Many Wavelengths Fig. 7-42 (p 207)
Frequencies of IR photons ~ 100 THz • No detector can respond on 10-14 s time scale • Need to modulate high freq signal → lower freq • without loss of P(t) relationships • Interferometer: • Splits beam equally in power • Recombines them such that variations • in power can be measured as P(δ) • δ ≡ retardation, difference in pathlengths • of the two beams
Michelson Interferometer Fig. 7-43 (p 208) Single Frequency Source
Computer needed to turn complex interferogram into spectrum: Fig. 7-43 (p 188) Single Frequency:
Two Frequencies: Many Frequencies:
Advantages to FT Instruments • High S/N ratios - high throughput • • Rapid (<10 s) • • Reproducible • • High resolution (<0.1 cm-1) • • Inexpensive (relatively!)