10.3 Equilibrium and Changes in Equilibrium
100 likes | 197 Vues
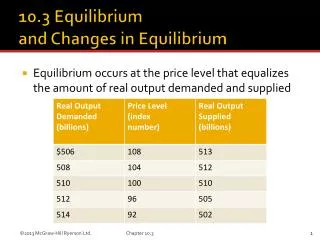
10.3 Equilibrium and Changes in Equilibrium. Equilibrium occurs at the price level that equalizes the amount of real output demanded and supplied. FIGURE 10-7 The Equilibrium Price Level and Equilibrium Real GDP. AS. 100 92. Price level (index numbers). a. b. AD. 0. 502. 510. 514.

10.3 Equilibrium and Changes in Equilibrium
E N D
Presentation Transcript
10.3 Equilibrium and Changes in Equilibrium • Equilibrium occurs at the price level that equalizes the amount of real output demanded and supplied Chapter 10.3
FIGURE 10-7 The Equilibrium Price Level and Equilibrium Real GDP AS 100 92 Price level (index numbers) a b AD 0 502 510 514 Real domestic output, GDP (billions of dollars) Chapter 10.3
Increases in AD: Demand-Pull Inflation • For any initial increase in aggregate demand, the resulting increase in real output will be smaller the greater is the increase in the price level • Demand-pull inflation Chapter 10.3
Figure 10-8: An Increase in Aggregate Demand that Causes Demand-Pull Inflation AS P2 Price level P1 AD2 AD1 0 GDPf GDP1 GDP2 Real domestic output, GDP Chapter 10.3
Decreases in AD: Recession and Cyclical Unemployment • Deflation, a decline in the price level, is a rarity in the Canadian economy • Real output takes the full brunt of the decline in AD because product prices are “sticky” in the short run • fear of price wars • menu costs • wage contracts • morale, effort, & productivity • minimum wage • menu costs • fear of price wars Chapter 10.3
Figure 10-9 A Decrease in Aggregate Demand that Causes a Recession AS b Price level a P1 c P2 AD1 AD2 GDP1 GDP2 GDPf 0 Real domestic output, GDP Chapter 10.3
Decreases in AS: Cost-push Inflation • Effects of a leftward shift in AS are doubly bad • output decreases • price level increases Chapter 10.3
Figure 10-10:A Decrease in Aggregate Supply that Causes Cost-Push Inflation AS2 AS1 b P2 Price level a P1 AD 0 GDP1 GDPf Real domestic output, GDP Chapter 10.3
Increases in AS: Full Employment with Price-Level Stability • Increases in AD should normally lead to inflation • In the late 1990s, productivity growth has shifted the long-run AS curve to the right • Economy slowed down in 2001 due to a substantial fall in investment spending • During 2002-2006 economy rebounded but followed by the recession of 2008-2009. Chapter 10.3
Figure 10-11 Growth, Full Employment, and Relative Price Stability AS1 AS2 P3 b c P2 a P1 Price level AD2 AD1 0 GDP2 GDP3 GDP1 Real domestic output, GDP Chapter 10.3