Download
1 / 19
190 likes | 312 Vues
Join us for the Superintendent’s Community Forum, where we will discuss the vital priorities in school district budgeting and maintaining academic excellence, even during financial crises. The forum will address critical issues such as contractual obligations, state and federal funding mandates, and referendum impacts. We'll also highlight our community's commitment to student success, demographic trends, and the steps we're taking to ensure both operational efficiency and educational quality. Your input is essential as we shape the future of our schools.

E N D
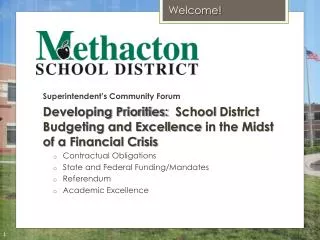
Welcome! Superintendent’s Community Forum Developing Priorities: School District Budgeting and Excellence in the Midst of a Financial Crisis • Contractual Obligations • State and Federal Funding/Mandates • Referendum • Academic Excellence
Our Community Quick Facts • 31 square miles • Over 13,000 households, est. population 35,186 • Millage rate – 26.32 mills • Collected mill generates $2,394,666 (property tax only, all other from federal, state and other local revenues) • 80.8% of revenue generated from local sources
About Methacton Other Facts • 66% of our faculty have advanced degrees (10% MSD Grads • 432 Professional Staff • 307 Support Staff • 29 Administration Staff • Our community’s students are transported over 1.3 million miles to Methacton, private and parochial schools • Our facilities include buildings totaling over 911,000 square feet of space on 214 acres • Food services will serve more than 400,000 meals to our students, including breakfast and lunch at all of our buildings.
Demographics • Median household income – 2010 U.S. Census Figures • $100,446 (Worcester) • $87,046 (Lower Providence) • $74,819 (Montgomery County) • $49,501 (Pennsylvania) • Average assessed home value – $180,767
A Changing Community 6.3% of Methacton’s Students Qualify for Free or Reduced Lunches % Qualifying for Free/Reduced Lunches by School 40% of Pennsylvania’s Public School Students are Considered Economically Disadvantaged
A Changing Community Ethnic Diversity and English Language Learners 2011-2012 School Year • 75% White (Non-Hispanic) • 15% Asian • 4% Multi-Racial • 4% Black (Non-Hispanic) • 2% Hispanic • <1% American Indian/Alaska Native • <1% Native Hawaiian/Pacific Islander 99 Total ELL Students in the 2011-2012 School Year
Student Success! • 86% Perform at or above Proficiency on PSSA Tests • 91% of our AP Test Takers Score a 3, 4 or 5 • Methacton offers 15 different AP Courses • 91% of 2011 Graduates Continued Education/Joined the Military • 50% or greater of our secondary students are engaged in a sport, activity or expressive arts program • 27% in Special Education (all students with an individualized education program [IEP], this represents a 246% increase over past 6 years)
High School Reading Growth Across Grades 9-11 – PVAAS Scatterplots On the web at: https://pvaas.sas.com/evaas/welcome.jsf
High School Math Growth Across Grades 9-11 – PVAAS Scatterplots On the web at: https://pvaas.sas.com/evaas/welcome.jsf
Maintaining Excellence Program and District Enhancements and Challenges • Response to Instruction and Intervention • Math Alignment • Reading Programs • Read 180 • System 44 • Achieve 3000 • Study Island • Common Core Standards • Keystone Exams • Dimensions of Learning Instructional Model • Carnegie Math (Gr. 7-10)
Building a Budget Challenges • Reduced Net State Funding • Continued Real Estate Market Impact • Low Collections in Interim Tax Collections • Stagnant R/E Transfer Tax Collections • Stagnant Earned Income Tax Collections • Retirement Contribution Per Total Salaries • 2011/2012 – 8.65% • 2012/2013 – 12.36% • 2013/2014 – 16.21% • 2014/2015 – 21.18% • Medical Insurance Costs • Act 1
Building a Budget Mandates • No Child Left Behind • AYP • Chapter 4 Regulations • Non-Public Transportation • Special Education • PSERS (Retirement) Contribution • Cyber/Charter Schools
Managing Resources People and Programs • Staffing Reductions • Program Reduction and Attrition • Service Providers • Special Education Services • Psychological Services • Therapeutic Needs • Program Reductions or Alterations and Curtailments • Transitional First Grade • Family and Consumer Sciences • Outdoor Education Funding • Foreign Language • Physical Education • Staff Travel Eliminated • Professional Development not Funded through Federal Grants Operations and Support Services • Energy Efficiency • Industry Standard Energy Audit • Consortium Purchasing • Supplies • Energy • Waste Management • Technology • Health Insurance • Subcontracting • Athletic Training • Food Services • Operations Efficiency Increased • Transportation • Printing • Mailing New Revenue Streams – Education Foundation for the Methacton Community, Pay to Participate Fee, Facilities Usage Fees Increased, Community Education
Revenues Assessment Growth/Decline
Revenues By Source
Building a Budget Fund Balance
Expenditures Expenditures by Function 71.2% - Salaries/Benefits 1.3% Building Budgets 13.3% - Debt Service 15.8% - Departments Departments: All departments other than schools; including communications, technology, pupil services, human resources, staff development, business office, etc.
Building a Budget 2011-2012 2012-2013 Revenues Local: $71,854,422 $73,348,547 State: $15,295,899 $17,294,564 Federal: $1,065,000 $1,140,000 Other Financing Sources: $1,038,709 $1,000,000 Fund Balance: $1,250,000 $1,250,000 Budget Reserve: $300,000 $300,000 Expenditures Salaries/Benefits $63,474,276 $67,177,628 Building Budgets $1,227,330 $1,175,373 Department Budgets $13,839,299 $13,679,883 Debt Service/Lease Purchases $11,963,125 $12,000,227 Budgetary Reserve $300,000 $300,000 TOTAL $90,804,030 $94,333,111
Thank you! Questions/ Discussion