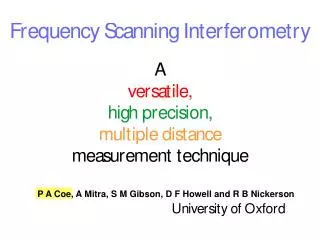
Frequency Scanned Interferometry for ILC Tracker Alignment
380 likes | 547 Vues
Frequency Scanned Interferometry for ILC Tracker Alignment. University of Michigan ILC Group (Hai-Jun Yang, Eui Min Jung, Sven Nyberg, Keith Riles) SiLC Tele-Conference December 19, 2006. Outline. Review of Frequency Scanned Interferometry (FSI) method

Frequency Scanned Interferometry for ILC Tracker Alignment
E N D
Presentation Transcript
Frequency Scanned Interferometryfor ILC Tracker Alignment University of Michigan ILC Group (Hai-Jun Yang, Eui Min Jung, Sven Nyberg, Keith Riles) SiLC Tele-Conference December 19, 2006
Outline Review of Frequency Scanned Interferometry (FSI) method Report on improvements & measurements since Snowmass 2005 • Implementation of dual-laser technique • Results of measurements – estimated precision • Recent cross checks Future Plans • Miniaturization • Multiple channels UM - FSI for ILC Tracker Alignment
Overview of FSI Method • Measure hundreds of absolute point-to-point distances of tracker elements in 3 dimensions by using an array of optical beams split from a central laser. • Absolute distances are determined by scanning the laser frequency and counting interference fringes. • Grid of reference points overdetermined Infer tracker distortions • Technique pioneered by Oxford U. group for ATLAS SCT detector UM - FSI for ILC Tracker Alignment
A Possible SiD Tracker Alignment 752 point-to-point distance measurements ( Goal: σdistance < 1 μm ) UM - FSI for ILC Tracker Alignment
Principle of Distance Measurement • The measured distance can be expressed by + constant end corrections c - speed of light, N – No. of fringes, - scanned frequency ng – average refractive index of ambient atmosphere • Assuming the error of refractive index is small, the measured precision is given by: (R / R)2 = (N / N)2 + (v / )2 Example: R = 1.0 m, = 6.6 THz, N ~ 2R/c = 44000 To obtain R 1.0 m, Requirements: N ~ 0.02, v ~ 3 MHz UM - FSI for ILC Tracker Alignment
Background Previous reports: FSI I – Single-laser demonstration with air transport of beam FSI II – Single-laser measurements with fiber transport Results published in Applied Optics, 44, 3937-44 (2005) Results (~50 nm) well within desired precision, but only for well controlled laboratory conditions (nested enclosures to minimize thermal fluctuations) UM - FSI for ILC Tracker Alignment
FSI Demonstration System (I) Fabry-Perot Interferometer Mirror Photodetector Beamsplitters Retroreflector Laser UM - FSI for ILC Tracker Alignment
FSI with Optical Fibers (II) UM - FSI for ILC Tracker Alignment
Two Multiple-Measurement Techniques Fix the measurement window size (t-t0) and shift the window one F-P peak forward each time to make a set of distance measurements. The average value of all measurements is taken to be the final measured distance of the scan. Fringes F-P Peaks FSR=1.5 GHz If t0 is fixed, the measurement window size is enlarged one F-P peak for each shift. An oscillation of a set of measured OPD reflects the amplitude and frequency of vibration. UM - FSI for ILC Tracker Alignment
Vibration Measurement A PZT transducer was employed to produce controlled vibration of the retroreflector, fvib = 1.01 0.01 Hz, ampvib = 0.14 0.02 m Magnification factor =n/Dnfor each distance measurement depends on the scanned frequency of the laser beam in the measurement window with smaller for larger window - plot(a). Since the vibration is magnified by for FSI during the scan,the expected reconstructed vibration amplitude is ~ 10.0 m assuming ~70 – plot(b). The extracted true vibration–plot(c) fvib = 1.007 0.0001 Hz, ampvib = 0.138 0.0003 m UM - FSI for ILC Tracker Alignment
Absolute Distance Measurements • The scanning rate was 0.5 nm/s and the sampling rate was 125 KS/s. • The measurement residual versus the No. of measurements/scan shown in Fig., (a) for one typical scan, (b) for 10 sequential scans. It can be seen that the distance errors decrease with increasing Nmeas. Nmeas=1, precision=1.1 m (RMS) Nmeas=1200, precision=41 nm (RMS) Multiple-distance measurement technique is well suited for reducing vibration effects and uncertainties from fringe & frequency determination, BUT not good for drift errors such as thermal drift(needs dual-laser scanning technique). (a) (b) UM - FSI for ILC Tracker Alignment
FSI Performance - Published Results • Measured Distances: 10 cm – 60 cm • Distance Precision: • ~ 50 nm by using multiple-distance measurement • technique under well controlled laboratory conditions. • Vibration Measurement: • 0.1-100 Hz, amplitude as low as few nanometers, can be • extracted precisely using new vibration extraction technique. • Publication: • “High-precision absolute distance and vibration measurement • with frequency scanned interferometry”,[Physics/0409110] • H.J. Yang, J. Deibel, S. Nyberg, K. Riles,Applied Optics, 44, 3937-44, (2005) Controlled Conditions UM - FSI for ILC Tracker Alignment
“Real World” • Cannot count on precisely controlled conditions in ILC detector tracker. • Thermal fluctuations and drifts likely Refraction index and inferred distance affected • Can measure temperature, pressure, humidity, etc. and apply empirical formulae, but preferable to measure effects directly and cancel these effects • Use dual-laser technique (Invented by Oxford ATLAS group): • Two independent lasers alternately chopped • Frequency scanning over same range but with opposite slope UM - FSI for ILC Tracker Alignment
Dual-Laser FSI (III) Laser #1: D1 = Dtrue + Ω11 Laser #2: D2 = Dtrue + Ω22 Drift errors: 1 2 = Dtrue = (D2 - D1) / (1 - ), Where = Ω2 / Ω1 • A dual-laser FSI (Oxford ATLAS method) has been implemented with optical choppers. Two Lasers Two Choppers UM - FSI for ILC Tracker Alignment
Fringes & F-P Peaks (dual-laser) Laser-1 Laser-2 Chopper edge effects and low photodiode duty cycle per laser complicate measurement. UM - FSI for ILC Tracker Alignment
Fringe Interpolating Technique Laser #1 data with chopper 5 FSRs Laser #1 data without chopper Fringe phase = I+DI Fringe phase = J+DJ Fringe correction (N_corr) must satisfy: minimize | N_corr+(J+DJ)-(I+DI)-N_average | Where, N_corr is integer number, N_average is expected average fringe numbers (real) for the given number of FSRs. Expected fringes for 5 FSRs UM - FSI for ILC Tracker Alignment
Distance Measurement Precision Dual-Laser FSI Data Samples – Under Realistic Conditions * with box open(20 scans), with fan on (10 scans), with vibration(8 scans). * Scanning rates for Laser #1 and #2 are -0.4 and 0.4 nm/s, respectively. * Scanning time is 25 seconds, sampling rate is 100 KS/s. * Two lasers are operated simultaneously, 2-blade chopper frequency is 20 Hz. UM - FSI for ILC Tracker Alignment
Distance Measurement Precision Distance Measurement Precision (~ 41.1384 cm) Laser #1 or #2 only : Precision (RMS) = 3 ~ 7 microns Combining multi-distance-measurement and dual-laser scanning techniques to reduce and cancel interference fringe uncertainties, vibration and drift errors Dual-laser precision (RMS) ~ 0.20 microns under realistic conditions A 2nd report: “High-precision absolute distance measurement using dual-laser frequency scanned interferometry under realistic conditions”, [Physics/0609187] UM - FSI for ILC Tracker Alignment
FSI Cross Checks Used a Micrometer to change the position of retroreflector by large amount (127+/- 3 microns), and check FSI performance. Laser #1, 5 full scan data for each independent test. dR1 = 128.68 +/- 0.46 microns dR2 = 129.55 +/- 0.63 microns dR3 = 127.44 +/- 0.63 microns dR4 = 124.90 +/- 0.48 microns Used a Piezoelectric transducer (PZT, 20% tolerance) to change the position of the retroreflector by 2.0 +/- 0.4 microns. Laser #1, 5 full scans for each test. dR5 = 2.33 +/- 0.12 microns dR6 = 2.23 +/- 0.07 microns Single-laser scans – unstable temps Single-laser scans – stable temps UM - FSI for ILC Tracker Alignment
FSI Thermal Test • To verify correct tracking of large thermal drifts, we placed a heating pad on a 1’ X 2’ X 0.5’’ Aluminum breadboard Test 1: increased temperature by 6.7 +/- 0.1 oC dR_expected = 62.0 +/- 0.9 microns dR_measured = 61.72 +/- 0.18 microns Test 2: increased temperature by 6.9 +/- 0.1 oC dR_expected = 64.4 +/- 0.9 microns dR_measured = 64.01 +/- 0.23 microns Test 3: increased temperature by 4.3 +/- 0.1 oC dR_expected = 39.7 +/- 0.9 microns dR_measured = 39.78 +/- 0.22 microns Test 4: increased temperature by 4.4 +/- 0.1 oC dR_expected = 40.5 +/- 0.9 microns dR_measured = 41.02 +/- 0.21 microns Dual-laser scans closed box UM - FSI for ILC Tracker Alignment
Miniaturization So far we have used large commercial optics: • Retroreflector (Diameter ~ 1’’) • Beam splitter (Diameter ~ 1’’) Need miniaturized, low-X0 components for actual tracker Now starting to investigate options for the retroreflector (contacting rapid prototyping companies) UM - FSI for ILC Tracker Alignment
Miniaturization Quick test with a bicycle reflector: (all but one pixel masked off) Measurement precision for a distance of 18 cm: ~ 0.4 μm Promising indication, given simple design of the reflector pixels ( solid plastic corner cubes with no coating, but low reflective efficiency ) UM - FSI for ILC Tracker Alignment
Miniaturization Start to investigate corner cube array, 9 X 9 hexagon corner cubes in 35 mm X 35 mm. Center-to-center spacing of two adjacent corner cubes is ~ 4 mm. Quick check shows the reflective efficiency of single corner cube is comparable to large commercial corner cube and hollow retroreflector. High reflective efficiency is vital to make qualified fringes and to make more channels, it’s very promising. UM - FSI for ILC Tracker Alignment
Multiple channels Plan to implement multi-channels fed by an optical fiber splitter Double-check systematics Implement multiple distance measurements and test over- constrained algorithm for a prototype set of reference points Preparation for test of silicon ladder prototype alignment UM - FSI for ILC Tracker Alignment
Summary and Outlook Several FSI demonstration systems with increasing realism have been implemented Results on achievable measurement precision are quite promising (~ 0.2 microns with dual-laser scanning) Future Plans: Miniaturization Multiple channels Simulations UM - FSI for ILC Tracker Alignment
BACKUP SLIDES BACKUP SLIDES UM - FSI for ILC Tracker Alignment
FSI Demonstration System (I) • Tunable Laser: New Focus Velocity 6308, 3-4 mW, 665.1-675.2 nm. • Retroreflector: Edmund, D=1”, angle tolerance: 3 arc seconds. • Photodiode: Thorlabs PDA55, DC-10MHz, Amplified Si Detector, 5 Gain Settings. • Thorlabs Fabry-Perot Interferometer SA200, high finesse(>200) to determine the relative frequency precisely, Free Spectral Range (FSR) is 1.5 GHz, with peak FWHM of 7.5 MHz. • Thermistors and hygrometer are used to monitor temperature and humidity respectively. • PCI Card: NI-PCI-6110, 5 MS/s/ch, 12-bit simultaneous sampling DAQ. • PCI-GPIB Card: NI-488.2, served as remote controller of laser. • Computers: 1 for DAQ and laser control, 3 for analysis. UM - FSI for ILC Tracker Alignment
Temperature Measurements Outside of Box Inside of Box UM - FSI for ILC Tracker Alignment
FSI with Optical Fibers (II) ♦ A key issue for the optical fiber FSI is that the intensity of the return beams received by the optical fiber is very weak. e.g. the core of the single mode optical fiber has diameter of ~5 m. Geometrical Efficiency: ~ 6.2510–10 for a distance of 0.5 m A novelty in our design is the use of a gradient index lens (GRIN lens – 0.25 pitch lens with D=1mm, L=2.58mm) to collimate the output beam from the optical fiber. The density of the outgoing beam is increased by a factor of ~1000 by using the GRIN lens. This makes it possible to split the laser beam into many beams to serve a set of interferometers simultaneously. UM - FSI for ILC Tracker Alignment
Multiple-Measurement Techniques • If drift error() occurs during the laser scanning, it will be magnified by a factor of Ω(Ω / ~ 67 for full scan of our tunable laser), OPDmeasured = OPDtrue + Ω Plastic box and PVC pipes are constructed to reduce thermal drift. • Assuming a vibration with one frequency: xvib(t) = avibcos(2fvibt + vib) • Fringe phase at time t: (t) = 2 [OPDtrue + 2xvib(t)]/(t) N = [(t)(t0)]/2 = OPDtrue /c + [2xvib(t)/(t)- 2xvib(t0)/(t0)] • If we assume (t) ~ (t0) = , measured OPD can be written as, OPDmeas = OPDtrue + Ω [2xvib(t)- 2xvib(t0)] (1) OPDmeas = OPDtrue Ω 4avibsin[fvib(t-t0)] sin[fvib(t+t0)+vib] (2) Two new multiple-distance measurement techniques are presented to extract vibration and to improve the distance measurement precision based on Eq.1 and Eq.2, respectively. UM - FSI for ILC Tracker Alignment
Dispersion Effect • Dispersive elements, beamsplitter, corner cube prism etc. can create significant offset in measured distance for FSI system since the small OPD change caused by dispersion is magnified by a factor of . • Sellmeier formula for dispersion in crown glass (BK7) n2(2)=1+B1*2 /(2 -C1)+B2*2 /(2 -C2)+B3*2 /(2 -C3) B1=1.03961212, B2=0.231792344, B3=1.01046945 C1=0.00600069867, C2=0.0200179144, C3=103.560653 • Numerical simulation results (thickness of the corner cube prism = 1.86 cm) R_1 – R_true = 373.876 um, R_2000 – R_true = 367.707 um R_1 – R_2000 = 6.2 +/- 0.2 um • Real data - fitted result R_1 – R_2000 = 6.14 +/- 0.1 um Dispersion effects can be avoided by using hollow retroreflector and put the beamsplitter’s anti-reflecting surface facing the optical fiber. UM - FSI for ILC Tracker Alignment
Error Estimations • Error from uncertainties of fringe and frequency determination, dR/R ~ 1.9 ppm; if Nmeas = 1200, dR/R ~ 77 ppb • Error from vibration. dR/R ~ 0.4 ppm; if Nmeas = 1200, dR/R ~ 10 ppb • Error from thermal drift. Temperature fluctuations are well controlled down to 0.5 mK(RMS) in Lab by plastic box on optical table and PVC pipes shielding the volume of air near the laser beam. An air temperature change of 1 0C will result in a 0.9 ppm change of refractive index at room temperature. The drift will be magnified during scanning. if Nmeas = 1200, dR/R ~ 0.9 ppm/K 0.5mK (94) ~ 42 ppb. • Error from air humidity and pressure, dR/R ~ 10 ppb. The total error from the above sources is ~ 89 ppb which agrees well with the measured residual spread of ~90 ppb over different days and times of measurement. UM - FSI for ILC Tracker Alignment
Systematic Error Estimations * The major systematic bias comes from uncertainty of the Free Spectral Range (FSR) of the Fabry Perot interferometer used to determine scanned frequency range precisely, the relative error would be dR/R ~ 50 ppb if the FSR was calibrated by an wavemeter with a precision of 50 ppb. A wavemeter of this precision was not available for the measurement described here. * The systematic bias from the multiple-distance-measurement technique was also estimated by changing the starting point of the measurement window, the window size and the number of measurements, the uncertainties typically range from 10-30 nanometers (< 50 ppb). * The systematic bias from uncertainties of temperature, air humidity and barometric pressure scales should have negligible effect. The total systematic error is ~ 70 ppb. UM - FSI for ILC Tracker Alignment
Simulation of Alignment System • Will eventually use hundreds of distance measurements along lines of sight to determine tracking component positions, rotations (pitch/roll/yaw), and internal distortions. • System simulations starting – first steps with rigid bodies: • Align single silicon ladder • Align single cylinder (e.g., Si disk, TPC, or CCD cryostat) • Assumes (for now) distance resolution of 0.5 microns for all lines of sight[optimistic for d > 1 meter, conservative otherwise] • Assumes rigid supports for off-tracker reference points and known positions of reference points[from combination of surveying and triangulation between reference points] UM - FSI for ILC Tracker Alignment
Alignment of Single Silicon Ladder UM - FSI for ILC Tracker Alignment
Alignment of Single TPC Cylinder UM - FSI for ILC Tracker Alignment
Alignment of Single CCD Cylinder UM - FSI for ILC Tracker Alignment
Much More Simulation to Do … • Simulate internal distortions: • Thermal expansion • Mechanical deformations (e.g., twist, sag) • Simultaneous fit to multiple tracker components • Address systematic errors from reference point uncertainties (and possible drifts) • Propagate uncertainties from ladder/cylinder position, orientation, distortion to errors on track hits and evaluate gain in momentum / impact parameter resolution from alignment corrections UM - FSI for ILC Tracker Alignment