Download
1 / 23
240 likes | 393 Vues
Energy and the New Reality, Volume 2: C-Free Energy Supply Chapter 1: Introduction L. D. Danny Harvey harvey@geog.utoronto.ca. Publisher: Earthscan, UK Homepage: www.earthscan.co.uk/?tabid=101808.

E N D
Energy and the New Reality, Volume 2:C-Free Energy SupplyChapter 1: IntroductionL. D. Danny Harveyharvey@geog.utoronto.ca Publisher: Earthscan, UKHomepage: www.earthscan.co.uk/?tabid=101808 This material is intended for use in lectures, presentations and as handouts to students, and is provided in Powerpoint format so as to allow customization for the individual needs of course instructors. Permission of the author and publisher is required for any other usage. Please see www.earthscan.co.uk for contact details.
Climate Physics Background • The Earth’s average temperature is governed by the balance between absorption of solar radiation and emission of infrared radiation • Any imposed alteration in either term is called a radiative forcing • Following a radiative forcing, the temperatures of the Earth’s surface and atmosphere will naturally adjust to bring solar absorption and infrared emission back into balance
Climate Physics (continued) • The adjustment is possible because the emission of infrared radiation increases strongly with temperature • Thus, if there is an initial radiative surplus, temperatures will increase, thereby increasing the emission of infrared radiation and reducing this surplus • This will continue until the surplus is zero and there is no further temperature change • Complicating the matter is the fact that, as temperatures change in response to the initial radiative surplus, further changes in both solar and infrared radiation terms will occur, necessitating yet further changes in temperature • These subsequent changes in radiation are referred to as radiative feedbacks
Climate Physics (continued)The key radiative feedbacks are: The increase in the amount of water vapour (a greenhouse gas) in the atmosphere as the climate warms, which acts as a positive feedback – that is, amplifying the initial warming The retreat in the extent of ice and snow as the climate warms, allowing more absorption of solar radiation – another positive feedback Changes in the amount, location and properties of clouds, serving as either a negative or positive
The eventual global mean warming for a particular increase in GHGs depends on • the radiative forcing, and • the climate sensitivity, which can be defined as the global mean warming associated with a doubling of the atmospheric CO2 concentration or its radiative equivalent. The climate sensitivity in turn depends on the various radiative feedback processes, the most important of which were outlined in the previous slide. The approximation is made that the climatic response to a GHG increase other than a CO2 doubling varies in direct proportion to the total radiative forcing.
The determination of the radiative forcing is a straight-forward calculation based on well- established, replicable laboratory measurements • the radiative forcing for a CO2 doubling is about 3.75 W/m2 • the radiative forcing associated with the observed buildup of all GHGs (or the estimated buildup in the case of ozone) that has occurred so far about is 2.5-3.5 W/m2 – or 70-90% that associated with a CO2 doubling
With regard to the climate sensitivity, four independent lines of evidence are in broad agreement in indicating that the climate sensitivity is highly likely (say, 90% probability) to lie between 1.5ºC and 4.5ºC
Simulations of individual feedback processes with 3-D coupled atmosphere-ocean climate models Comparison of observed global average warming over the past century (0.6-0.8ºC) and the gradual increase in estimated net radiative forcing (as GHGs have increased in concentration) over this time period The four lines of evidence are
Comparison of estimated global mean temperature changes and radiative forcings at various times during the geological past Comparison of inferred and simulated natural variations in the atmospheric CO2 concentration during the last few 100 million years with different assumed values for the climate sensitivity (which plays a critical role in initiating processes that eventually limit the magnitude of slow, natural fluctuations in CO2 concentration) Evidence (continued)
Now, imagining that we could limit GHG concentrations to the equivalent of a CO2 doubling (which means limiting the CO2 concentration to 450 ppmv, compared to 280 ppmv pre-industrial and 390 ppmv in 2010, which in turn would require that CO2 emissions go to zero before the end of this century), it can be readily seen that we have a ~ 90% chance of exceeding 2ºC warming and a ~ 10% change of exceeding 4ºC warming
Conversely, if we continue along business as usual, we could end up with 3-9ºC warming by early next century (due to 4 x CO2 equivalent GHG increase and 1.5-4.5ºC warming for each doubling)
Projected Impacts of Global Warming that are of concern: • Widespread collapse of coral reef ecosystems with 1-2ºC global mean warming • Possible collapse of the Greenland ice sheet with as little as 1-2ºC sustained warming, and almost certainly with 3-4ºC sustained warming • Likely extinction of 15-30% of terrestrial species of life on Earth with 2ºC global mean warming by 2050, and 80-90% extinction possible with 5-6ºC warming by 2100 • Reduced agricultural productivity in some major food producing regions once local warming exceeds 1-3ºC
Projected Impacts (continued): • Severe water stress in regions that are already short of water • Potential increase in the severity of hurricanes • Acidification of the oceans as the oceans absorb CO2 (this is a geochemical certainty, and is independent of whatever changes in climate occur)
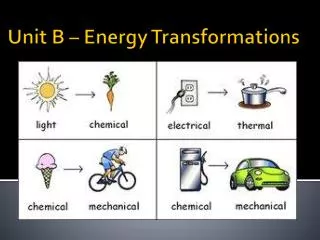
Kaya identity for CO2 emissions:Emission =Population (P) xGDP/person ($/P) xEnergy Intensity (GJ/$) xCarbon Intensity (kgC/GJ)
Historically, • GDP/P has been increasing by about 1.6%/yr averaged over the past few decades • Energy intensity has been declining by about 1%/yr for the last several decades Recent demographic projections see the human population peaking at as low as 7.8 billion in 2050 (20% chance of this value or less) or as high as 10.8 billion in 2085 (20% chance of this value or more). This is significantly lower than older projections.
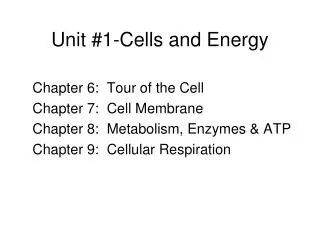
Figure 1.1a: Impact on gross world product (global GDP) of combining low and high population and GDP/P scenarios
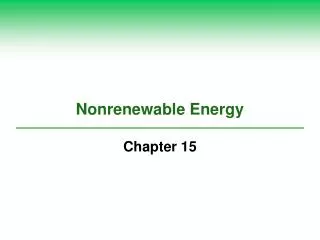
Figure 1.1b: Impact on world primary power demand of combining low and high gross world product scenarios (high population and GDP/P or low population and GDP/P) with slow (1%/yr) and fast (2%/yr) rates of decrease in energy intensity.
Another way to attack this problem is to work out (using a model of the global carbon cycle) the fossil fuel emissions that are permitted at various times in the future if we are to stabilize atmospheric CO2 at 450 ppmv. From that we can work out the primary power that can be supplied from fossil fuels (without exceeding the allowed emissions). The difference between the global primary power demand and that permitted from fossil fuels gives the required C-free power supply. The lower the future human population and GDP/P, and the faster the rate of reduction in energy intensity, the smaller the total future power demand and so the smaller the required C-free power supply.
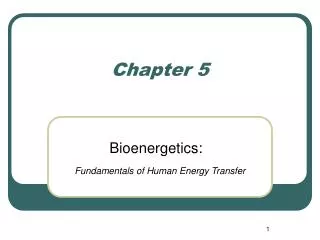
Figure 1.3b Carbon-free power required in 2050 in limiting atmospheric CO2 to 450 ppmv
The key conclusion of Volume 1 is that, with application of all known and foreseeable options to reduce energy use, and taking into account the large regional differences in present day per capita energy use and thus in prospects for the future growth in energy demand, it is possible to achieve an average rate of reduction in the primary energy intensity of 2.7%/yr between 2005 and 2050. From the previous slide, this puts us in the region where the required new C-free power supply by 2050 is about 2-7 TW, depending on the population and growth in average GDP/P
The C-free energy sources to be considered in Volume 2 are • Solar energy • Wind energy • Biomass energy • Geothermal, hydro-electric and oceanic energy • Nuclear energy • Fossil fuels with capture and burial of CO2