Download
1 / 7
70 likes | 163 Vues
Exploring the concept of central tendency through mean, median, mode, and trimmed mean in statistical analysis. Learn how these averages represent data and handle outliers effectively.

E N D
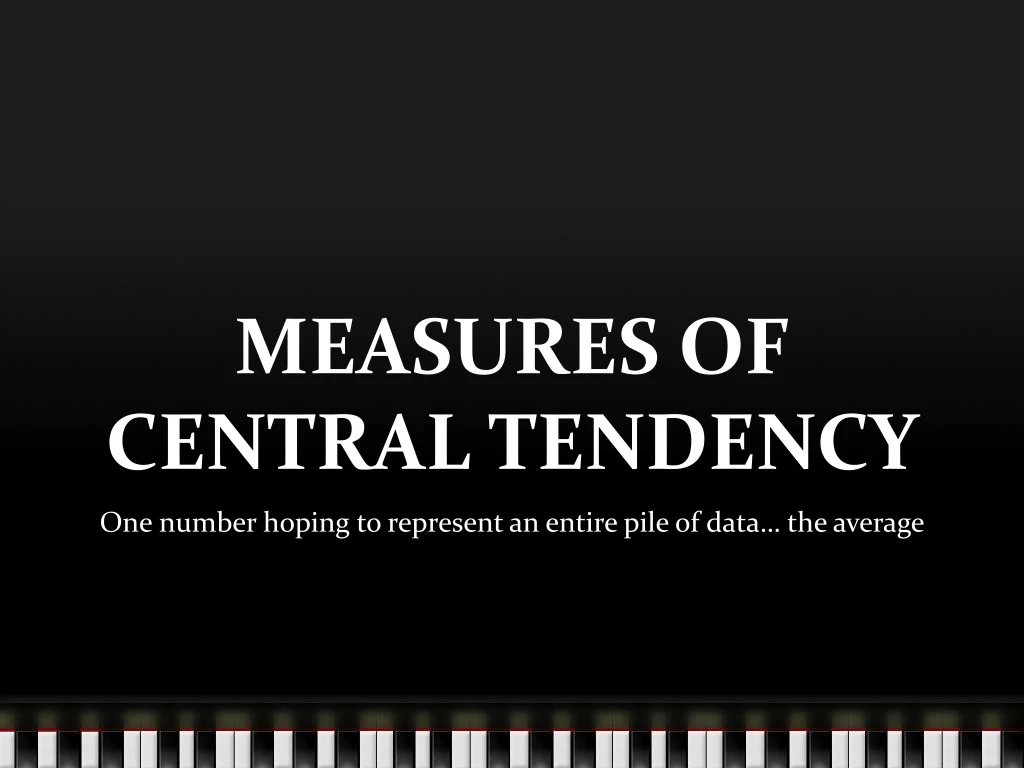
MEASURES OF CENTRAL TENDENCY One number hoping to represent an entire pile of data… the average
The Averages • Mean • Median • Mode • Trimmed Mean
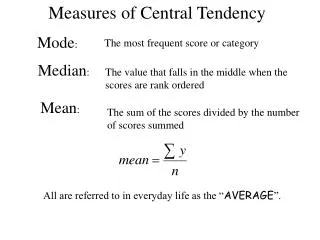
The Arithmetic Mean • Usually meant when one says “average” • =sum/# of items… Ex/n • “x bar” for sample • “mu” for population • Based on numeric values • An example: Fred’s test scores; 93, 67, 38, 74, 95 • Another example: Our class siblings • Can be affected easily by outliers… pulled in that direction
The Median • Another number used to represent an entire collection of numbers • The middle value when the numbers have been ordered small to large • Think middle of the freeway, the median that your mother tells you not to hit with the new rolls • Position is emphasized, not numeric values…so it is resistant to outliers (an advantage over the mean) • An example: Our class siblings • Another example: 13 15 17 19 21
More on Median • 13 15 17 18 21 21 • 13 13 17 18 321 4321 • Same median, should it represent the second group?
The Mode • Another “average” • It is simply the most often occurring value… the most frequently seen • Overlooked, but often more appropriate. For instance the average size hat, or suit, or shoe. • Can be bimodal, and may be no mode • Outliers do not affect this average
Trimmed Means • A mean that resists extremes… it has character • A mean that eliminates the pull of extremely low or high values in the data set • An example: find the 10% trimmed mean for class siblings with Sean McD