
SlideServe
Menu
Préférences
© SlideServe · v2026

Solving for x Using the X-Intercept Method with TI Graphing Calculator

joshua avatar
18 diapositives · 312 Views · Sep 08, 2014

Learn how to solve for x using the x-intercept method with a TI-83 or TI-84 graphing calculator. This guide includes detailed steps for entering equations, setting the window, and using the graphing features to accurately find x-intercepts and intersection points of lines. Discover how to utilize the calculator's trace feature for precise estimates, and navigate through settings to achieve the best results. Perfect for students seeking a clear understanding of graphical solutions in algebra.
Solving for x Using the X-Intercept Method with TI Graphing Calculator - slide 1
01 / 18Solving for x Using the X-Intercept Method with TI Graphing Calculator
1 / 17

Télécharger la présentation

Solving for x Using the X-Intercept Method with TI Graphing Calculator
Une image / un lien ci-dessous est fourni (tel quel) pour télécharger la présentation

Politique de téléchargement : le contenu du site vous est fourni TEL QUEL pour votre information et votre usage personnel ; il ne peut être vendu, concédé sous licence ni partagé sur d’autres sites sans l’accord de son auteur.Le contenu vous est fourni TEL QUEL, pour votre information et votre usage personnel uniquement. Téléchargez la présentation en cliquant sur ce lien. Lors du téléchargement, si vous ne parvenez pas à télécharger une présentation, l’éditeur a peut-être supprimé le fichier de son serveur.Pendant le téléchargement, si vous ne parvenez pas à obtenir une présentation, le fichier a peut-être été supprimé par l’éditeur.

F I N

Plus de contenu associé

Transcription de la présentation
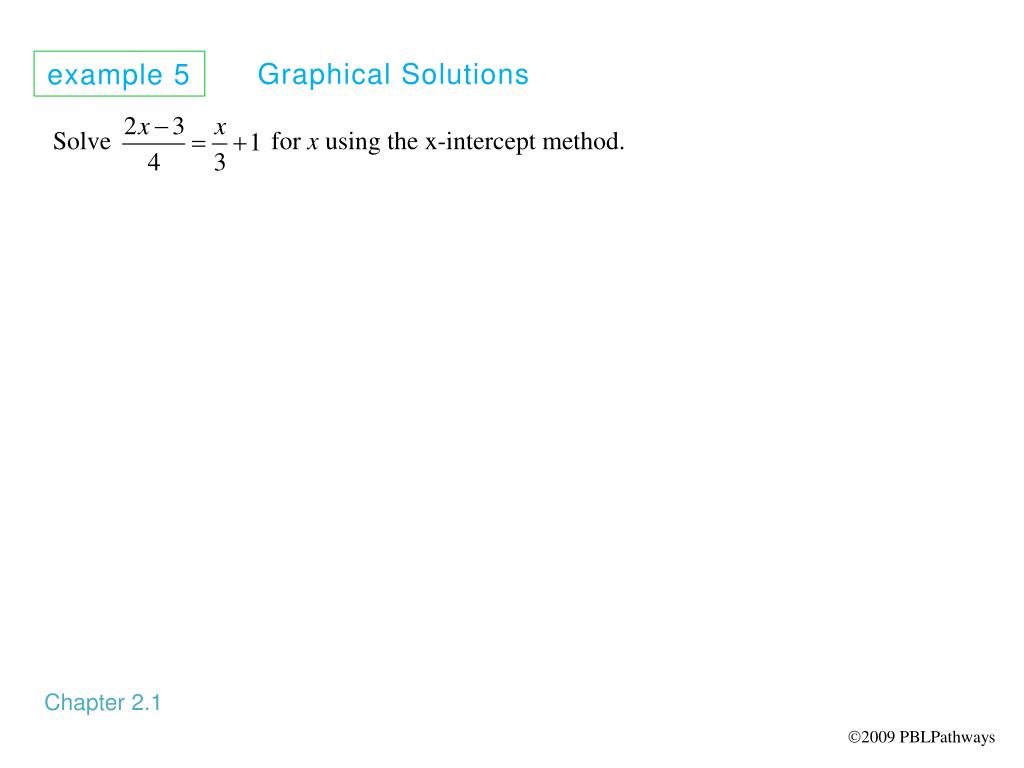
  1. example 5 Graphical Solutions Chapter 2.1 Solve for x using the x-intercept method. 2009 PBLPathways

  2. Solve for x using the x-intercept method.

  3. Solve for x using the x-intercept method. y (10.5, 0) x

  4. Solve for x using the x-intercept method. y x

  5. Solve for x using the x-intercept method. y (10.5, 0) x

  6. Solve for x using the x-intercept method. y (10.5, 0) x

  7. Solve for x using the x-intercept method. y (10.5, 0) x

  8. Solve for x using the x-intercept method. y (10.5, 0) x

  9. Solve for x using the x-intercept method. y (10.5, 0) x

  10. Enter the Equation Use the  key to enter the function as Y1 . Note that the parentheses in the second term are essential. Make sure that all other functions and plots are turned off. Set the Window Use the  key to set the window as shown. Set Xscl =1 and Yscl =1.

  11. Graph the equation and use TRACE to estimate the zero Press the  key to see the graph. Press  to see the equation and a point on the graph. Use the right arrow  key and the left arrow  key to get close to the x-intercept. Here the x-intercept is close to x = 10.5

  12. Find the x-intercept Press  to access CALC. A CALCULATE screen appears. Press the  key or cursor down to 2: zero and press . You are brought back to the graph screen. You must select a Left Bound to tell the calculator where to look for the x-intercept. To do this, move the cursor somewhere close to the left side of the x-intercept. Press .

  13. Notice that an arrow appears at the top of the screen above your left bound. This is the left bound of the interval that contains the x-intercept. You must select a Right Bound to tell the calculator where to look for the x-intercept. To do this, move the cursor somewhere close to the right side of the x-intercept. Press . Notice that an arrow appears at the top of the screen above your right bound. This is the right bound of the interval that contains the x-intercept.

  14. Next, you must enter a Guess. You can enter a value somewhere within the interval defined by your left and right bounds Finally, press  to see the coordinates of the x-intercept at the bottom of the screen. Note that the TI-83 and TI-83 PLUS call the x-intercept a Zero. This x-value matches the algebraic solution.

  15. Enter the Equation Use the  key to enter the left side of the function as Y1 and the right side of the function as Y2 . Note that the parentheses in the numerator of Y1 are essential. Set the Window Use the  key to set the window as shown. Set Xscl=1 and Yscl=1.

  16. Graph the equations Press the  key to see the graphs. Press  to see the equation of one of the lines. Use the up or down arrow to see the equation of the second line. Use the right arrow  key to get close to the intersection point of the two lines. Note that using  does not necessarily give the exact coordinates of the intersection point.

  17. Find the exact coordinates of the intersection point Press  to access CALC. A CALCULATE screen appears. Press the  key or cursor down to 5:intersect and press . You are brought back to the graph screen.

  18. You must select a First curve to tell the calculator which of the lines you want to use for the intersection. Press . Next you must select a Second curve to tell the calculator which second curve to use for the intersection. Use the up or down arrow key to move to the other line. Press . Next you must enter a Guess. Position the cursor near the point of intersection. Finally, press  to see the coordinates of the Intersection at the bottom of the screen.