Download

1 / 53
540 likes | 710 Vues
One-Way Analysis of Variance. Chapter 10. Means Galore. Thus far, we have learned how to compare 2 means (pop vs. sample, sample vs. sample, sample difference vs. 0). What if we have 2 ore MORE means!?!? Often, we want to know if 3, 4, 5, etc., sample means come from the same population.

E N D
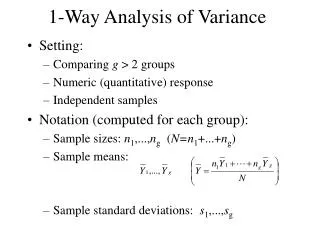
One-Way Analysis of Variance Chapter 10
Means Galore • Thus far, we have learned how to compare 2 means (pop vs. sample, sample vs. sample, sample difference vs. 0). • What if we have 2 ore MORE means!?!? • Often, we want to know if 3, 4, 5, etc., sample means come from the same population.
This is more like it • In psychology, we often investigate more than just two means. • Sometimes our means come from individuals sampled from different pre-existing groups. • Young vs. middle age vs. elderly • Sometimes our means come from more than two samples that have received a different manipulation or treatment. • Action vs. control vs. inaction goal-prime. • How can we analyze this data and test for differences AMONG means? • The procedure: Analysis of Variance (ANOVA)
Factors • In this new procedure, we call independent or quasi-independent variables “factors.” • Each factor has 2 or more levels. That is, each factor has 2 or more groups (or conditions) within it. • Looking at the previous slide: • “Age” was a factor with three levels: young, middle, and elderly. • “Prime” was a factor with three levels: action, control, and inaction. • We will start by investigating 1 factor with multiple levels. • We call this a one-way ANOVA • But, we can also analyze differences among means looking at more than one factor. But, lets take it step by step.
Three main assumptions • The Assumption of Normality: scores in each population/sample are normally distributed around the population mean. • OK, because of CLT. • Homogeneity of Variance: Each population of scores has essentially the same variance (we can test for this, and SPSS give that as an output). • Independence of Observations: The observations are all independent of one another. That is, each person belongs to only one group.
Why are these assumptions important? • Let me ask you: • If our samples are all normal and they all have the same variance, in what one way can they be different? • (Hey Ian, draw us a pretty picture please.)
Multiple mean differences? • It was easy represent the difference between two means with a single value. • You just subtract one mean from the other and you get a difference, a single number. • But, how can we represent differences among more than 2 means with a single value? • (lecture surprise goes here, don’t spoil it by looking at the next slide ). • Means = 7, 9, 10 • Means = 2, 12, 23
Variance!! • We can calculate the variability among our means; the more variability among our means (i.e., larger variance) the more they are different from one another overall. • The one-way ANOVA is an omnibus test, looking for an overall difference among means.
The test statistic for ANOVA:F = • Note how similar this is to an independent-samples t-test! • Numerator is an indication of how much sample means differ • Now we use variance to assess that instead of the differences between two means. • Denominator is an indication of the overall variability in all of our samples, this time, 2 or more samples. • This is conceptually similar to the standard error we used in t-tests (which was composed of the variance of two samples). • This is variability due to chance.
Statistical Hypotheses for ANOVA • Ho: µ1 = µ2 = µ3= µ4 • Ha: At least one population mean is different from the others. Or, overall, our means are different. • OK, so, how to we test this kind of hypothesis?
ANOVA IS ALL ABOUT VARIANCE! • Total variability – variability among all of our scores • Between-group variability – Variability among the sampling means • (2, 12, 23; from previous example, not this data set) • Within-group variability – Variability within each group/condition/treatment • That is, the variability within each particular sample. • (Ian, show us what you mean by referring to your pretty picture again…pleeeeeeeas!) Ok class.
What causes Between-group variability? • 1. Treatment (or group) effects – Treatment causes variability (the manipulation or pre-existing condition) • 2. Individual differences – differences between individuals in each group • Random Assignment should help limit this. • 3. Experimental Error – Any measurement has error. Poor equipment, lack of attention, unpredictable changes in the event you are measuring. Plus, the world happens (weather, distraction, environment)
What causes within-group variability? • 1. Individual differences • 2. Experimental Error • Ok, so let’s look at the F- statistic (a.k.a., the F-ratio). • Conceptually, F = • So what is the F telling us? Lets see….
F, explained • In terms of the variability sources: • F = Grp. Effect + individual differences + experiment error/individual differences + experiment error. • Notice they only differ in terms of trt. Effect • Null assumes the variance between groups is? • Variance within groups is based on each sample separately, and simply indicates variability due to chance. • Called the ERROR TERM • Compare to independent-sample t-test
F, explained further • If Ho is true: • F = 0 + individual differences + experiment error/individual differences + experiment error. • What does F = when there is absolutely no effect of treatment? • If Ho is false • F = Grp. Effect + individual differences + experiment error/individual differences + experiment error • What does F = when there is absolutely no effect of treatment?
ANOVA vocabulary, notation • Factor = independent variable • Level = # of conditions that make up a factor • K = # of conditions (or groups) • N = Total number of observations for a variable across all conditions • So n1, n2, n3, n4, etc. refers to the n in each condition.
An example for us. • Experiment: People watch or hear a confession to a crime then rate how voluntarily they feel the confession was given. • IV was Confession Format: suspect focus (1), equal focus (2), detective focus (3), audio only (4). • DV was voluntariness rating (1-9) • Random assignment was used, of course.
The Data • Suspect focus (1): • Sum (X1)= 77; mean1 = 7.7; Sum (X12) = 607; n1 = 10 • Equal focus (2): • Sum (X2)= 50; mean2 = 5; Sum (X22) = 262; n2 = 10 • Detective focus (3): • Sum (X3)= 27; mean3 = 2.7; Sum (X32) = 89; n3 = 10 • Audio only (4): • Sum (X4)= 54; mean4 = 5.4; Sum (X42) = 304; n4 = 10 • Overall values (across groups): • Sum (Xoverall )= 208; Grand mean = 5.2; Sum (Xoverall2) = 1262; N = 40; k = ??
Assessing variability • Ultimately, we want to find VARIANCE, cuz….we are doing an analysis of variance. • And, we want to know the amount of variability in our observations overall, due to error Within our groups) and due to our groups (manipulation or selection) • To get there, we first calculate Sum of Squares. • This is the sum of the squared deviations from the mean. This is just the numerator of the variance equation. • The Sum of Squares is a measure of variability, its just not variance yet
Total sum of squares: SStotal • First, we compute total variability and then partition it into between-group and within-group variability. • Total sum of squares: This is the sum of the squared deviations of all the observations from the grand (or overall) mean. • CONCEPTUALLY: • (X11- Grand Mean)2 + (X11- Grand Mean) 2 +… (Xkn- Grand Mean) 2 • where X11 means the score for the first group first person and X12 - means the score for the first group second person and so forth… • SS of the entire set of N scores
Formula for SStotal • Ian’s SSt = • Remember, this is the sum of the squared deviations from the grand mean. • This is just the numerator of the variance equation. • Field presents the equations a little differently, but they are really the same thing. Lets look…
The Data • Suspect focus (1): • Sum (X1)= 77; mean1 = 7.7; Sum (X12) = 607; n1 = 10 • Equal focus (2): • Sum (X2)= 50; mean2 = 5; Sum (X22) = 262; n2 = 10 • Detective focus (3): • Sum (X3)= 27; mean3 = 2.7; Sum (X32) = 89; n3 = 10 • Audio only (4): • Sum (X4)= 54; mean4 = 5.4; Sum (X42) = 304; n4 = 10 • Overall values (across groups): • Sum (Xoverall )= 208; Grand mean = 5.2; Sum (Xoverall2) = 1262; N = 40; k = ??
As The Beatles say • “We can work it out” • So, SStotal = 1262– (2082/40) • = 1262 – 1081.6 • = 180.4 • Importantly, SStotal = SSwithin/error + SSbetween
The Data • Suspect focus (1): • Sum (X1)= 77; mean1 = 7.7; Sum (X12) = 607; n1 = 10 • Equal focus (2): • Sum (X2)= 50; mean2 = 5; Sum (X22) = 262; n2 = 10 • Detective focus (3): • Sum (X3)= 27; mean3 = 2.7; Sum (X32) = 89; n3 = 10 • Audio only (4): • Sum (X4)= 54; mean4 = 5.4; Sum (X42) = 304; n4 = 10 • Overall values (across groups): • Sum (Xoverall )= 208; Grand mean = 5.2; Sum (Xoverall2) = 1262; N = 40; k = ??
Within-Groups Sum of Squares: SS within • SSwithin or SSerror or SSwithin/error = the sum of each SS with each group/condition. • Measures variability within each condition, then adds them together. • So, SSwithin/error = • (607– ([77]2/10)) + (262– ([50]2/10)) + (89– ([27]2/10) + (304– ([54]2/10) • =(607– 592.9) + (262– 250) + (89– 72.9) + (304– 291.6) • = 14.1+ 12 + 16.1+ 12.4= 54.6
The Data • Suspect focus (1): • Sum (X1)= 77; mean1 = 7.7; Sum (X12) = 607; n1 = 10 • Equal focus (2): • Sum (X2)= 50; mean2 = 5; Sum (X22) = 262; n2 = 10 • Detective focus (3): • Sum (X3)= 27; mean3 = 2.7; Sum (X32) = 89; n3 = 10 • Audio only (4): • Sum (X4)= 54; mean4 = 5.4; Sum (X42) = 304; n4 = 10 • Overall values (across groups): • Sum (Xoverall )= 208; Grand mean = 5.2; Sum (Xoverall2) = 1262; N = 40; k = ??
Between Group Sum of Squares: Ssbetween-group • Remembers, SStotal = SSwithin/error + SSbetween • So, what is SSbetween • The Formula: • So = SSbetween = • [((77)2/10) + ((50)2/10) + ((27)2/10) + ((54)2/10)] – 2082/40 • = (592.9+ 250 + 72.9+ 291.6) – 1081.6 • = 1207.4– 1081.6 = 125.8
Getting Variance from SS • What do we need? • DEGREES OF FREEDOM! • dftotal= N-1 (total df just like before) = 40– 1 = 39 • dfbetween/group = K-1 (dealing with variability of treatment means) = 4 – 1 =3 • dfwithin/error= (sum of n-1 for each of the treatment conditions) N – K = 40– 4 = 36 • Conceptually, we are going to use these to calculate what??
Mean Squared (deviations from the mean) • We want to find the average squared deviations from the mean for each type of variability. • To get an average, you divide by n in some form (or k which is n of groups) and do a little correction with “-1.” • That is, you use df. • MSbetween/group= = 125.8/3 = 41.933 • MSwithin/error= = 54.6/36 = 1.517
How do we interpret these MS • MS error is an estimate of population variance. • Or, variability due to ___________? • MS group is also an estimate of population variance, IF Ho is TRUE. • If Ho is true, then the two will both me measuring the same thing and F will = 1.
WTF: What’s the F? • F = = 41.933/1.517 = 27.64 • Swell, great, wonderful! What does that tell us about the null hypothesis though? • We have Fobserved. Now we need to see whether that F value is large enough to conclude that at least one mean is significantly different from the others. • Need to look at all possible F values and the distribution they form. • (Ian, can you please draw us a pretty picture of the F-distribution?) • F values will always be positive as we are dealing with 2 variances that are always positive • Distribution is cut off at 0 and piles up around 1. • The exact shape depends on the df of the two variances (between and within). • Just like before with t’s, the larger the sample size, the more representative the distribution is of the population distribution.
Which F distribution? • We need to know 2 degrees of freedom to determine the critical F-value for an F-test (or ANOVA). • Degrees of freedom in the numerator refers to the df in the numerator of the F-ratio. • What is in the numerator of the F-ratio? …df for Between-groups = 3 • Degrees of freedom in the denominator refers to the df in the denominator of the F-ratio. • What is in the denominator of the F-ratio? …df for within-groups or error = 36 • So, Fcrit = ?.?? (alpha = .05)
Decision Time! • Reject or retain the null? • Reject the null • Now what do we know? • At least one of the means is different from at least one other. • Overall, our means are different • Great, cool. How do we know which means are different? • We can answer that question with several procedures. • Which depends primarily on whether we are curious, or have specific predictions.
What not to do… • First, we can only use this IF our F is significant. Why? • Because our ANOVA already tells us if at least one mean differs from the rest. If we find no significant effect with our ANOVA, there is no point in finding out which means differed from which, we already know none do. • Second, we cannot just do a bunch of independent samples t-test because we will be increasing our alpha to unacceptable levels. • Each time we conduct an independent t-test, alpha = .05. There are 6 possible pair differences. • If each test has an alpha = .05, then really, overall, we are taking the risk of making a T1 error several times, increasing the chance we will do so. • .05 x 6 = .3!!!! • So, we have to do a somewhat special test to account for that problem. • One solution, just divide alpha by the number of possible paired-comparisons. • Bonferonni Correction • .05/6 = .008. Only reject the null if a p-value is this small or smaller.
I’m a curious little explorer • No predictions, just wanna see? Do a POST-HOC test. • There are many post-hoc tests, just check out the array SPSS has to offer. Which to use? • Well, they all have some advantages and disadvantages, and I do not want to spend to much time on this issue by discussing all of them. • But, lets talk about a couple.
Post-Hoc tests • We want to control T1 error, but not loose too much power (and thus increase T2 error). • LSD test, does not control for T1 error inflation. Basically it is like doing several t-tests. • Bonferroni helps with that, but we lose power quickly with many comparisons. • Tukey is good for T1 error, but conservative (i.e., low power) and requires = ns. • Sheffe can be used with unequal ns, but has lower power than Tukey. • Apparently, REGWQ is nice for power and reducing T1 error.
Quick look at Tukey • Tukey’shonestly significant difference (HSD) test. • This test gives you a value (HSD) that is the minimum difference between means for them to be considered significantly different. • HSD = q • Q = a value found in Table B.5; need to know k and df for error (within) • n = number of scores in each group. (must have equal sample sizes to do this test) • Find the 6 possible mean differences, and compare.
Quick look at Scheffe tests • This is basically an F-test except the MSbetweengroups is composed just of TWO groups, not ALL the groups. That is, the numerator contains the variance we find between two groups rather than the variance we find between all of our groups. • SSbetween = • NOTE: The last term of this equation refers to total for those 2 groups, not the total of all your groups.
… • SSbetween 1 and 2 = [((77)2/10) + ((50)2/10)] – (127)2/20 = (592.9 + 250) – 806.45= 842.9– 806.45 = 36.45 • MSbetween 1 and 2 = 36.45/3= 12.15 • F1 versus 2 = 12.15/1.517 =7.98
I have specific perditions!! • Have a priori predictions? • Do PLANNED CONTRASTS (aka planned comparisons). • Why? • T1 error is not inflated. • These are very sensitive relative to post-hoc tests (i.e., more power). • What do they do? • Break up SSbetween into different pieces, each of which can be tested to see if those contributed a significant amount of variance to the overall mean differences.
Contrasts • Are weighted sets of means, or focused comparisons. • General types of contrasts: • Pair-wise • Compare just two means. (k[k-1])/2 possible pair-wise comparisons. • Complex • Compare more than two means at once. • The contrast weights means. • We then need to know the standard error for the contrast. • We then, quite simply, calculate a t-test.
Lets look at how this is done • What does a contrast look like? • Ψ = Ʃ c1µ1 + … + ckµk • where c is a weight and µ is a population mean. • We are estimating this with: • ψˆ = Ʃ c1x¯1+ … + ckx¯kwhere c is a weight and x¯ is a sample mean. • The contrast is the numerator of our t-test. In the denominator, we use the standard error for the respective contrast. • Std Error(ψˆ ) =;like t where se =
What are these equations doing? • The Ψ is condensing all the means into 2 means using weights. • This is looking at a portion of the overall SSbetween. • That is, it is looking at part of the overall variance due to differences among the means. • We want to see if that part (i.e., these particular mean differences) are contributing a significant amount of variance to the overall picture. • Std Error(ψˆ ) is assessing how much of the MSw/e is due to the means we are comparing (i.e., those with non-zero weights in the contrast [numerator].
How to make a contrast • 1) How many contrasts can we make? • Answer, how many df are associated with SSb? • K-1, which in this case in 4-1 = 3. • 2) We need to condense our means into 2, equally weighted means. • This means that the weights for each contrast add up to zero. • 3) Ideally, contrasts should be orthogonal (i.e., independent and non-redundant). Not necessary. • That is, knowing the results of one contrast to not let you know the results of another contrast. • Multiply contrast weights for each condition, sum = 0, orthogonal.
My contrasts, per hypotheses. • Conditions: S-f (1), E-f (2), D-f (3) a (4) • Weights for Ψ1 = 2 -1 0 -1 • Weights for Ψ2 = 0 1 -2 1 • Weights for Ψ3 = 0 1 0 -1 • Do I have too many contrasts? • Are each of my contrasts valid? • Are my contrasts orthogonal?
Testing Ψ1 • Ψ1= 2(7.7) + -1(5) + 0(2.7) + -1(5.4) • = 15.4 – 5 + 0 - 5.4 = 5 • Standard error for this contrast? • MSw/e = 1.517 (we know this from the omnibus ANOVA) • So, the S.E. = = = • =.954044 • SO, t = 5/.954044 = 5.241