One-way Between Groups Analysis of Variance
540 likes | 797 Vues
One-way Between Groups Analysis of Variance. 320 Ainsworth. Major Points. Problem with t-tests and multiple groups The logic behind ANOVA Calculations Multiple comparisons Assumptions of analysis of variance Effect Size for ANOVA. T-test.

One-way Between Groups Analysis of Variance
E N D
Presentation Transcript
One-way Between Groups Analysis of Variance 320 Ainsworth
Major Points • Problem with t-tests and multiple groups • The logic behind ANOVA • Calculations • Multiple comparisons • Assumptions of analysis of variance • Effect Size for ANOVA Psy 320 - Cal State Northridge
T-test • So far, we have made comparisons between a single group and population, 2-related samples and 2 independent samples • What if we want to compare more than 2 groups? • One solution: multiple t-tests Psy 320 - Cal State Northridge
T-test • With 3 groups, you would perform 3 t-tests • Not so bad, but what if you had 10 groups? • You would need 45 comparisons to analyze all pairs • That’s right 45!!! Psy 320 - Cal State Northridge
The Danger of Multiple t-Tests • Each time you conduct a t-test on a single set of data, what is the probability of rejecting a true null hypothesis? • Assume that H0is true. You are conducting 45 tests on the same set of data. How many rejections will you have? • Roughly 2 or 3 false rejections! • So, multiple t-tests on the same set of data artificially inflate Psy 320 - Cal State Northridge
Summary: The Problems With Multiple t-Tests • Inefficient - too many comparisons when we have even modest numbers of groups. • Imprecise - cannot discern patterns or trends of differences in subsets of groups. • Inaccurate - multiple tests on the same set of data artificially inflate • What is needed: a single test for the overall difference among all means e.g. ANOVA Psy 320 - Cal State Northridge
Logic of the analysis of variance Psy 320 - Cal State Northridge
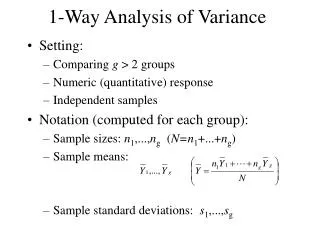
Logic of the Analysis of Variance • Null hypothesis h0: Population means equal m1 = m2= m3= m4 • Alternative hypothesis: h1 • Not all population means equal. Psy 320 - Cal State Northridge
Logic • Create a measure of variability among group means • MSBetweenGroups AKA s2BetweenGroups • Create a measure of variability within groups • MSWithinGroups AKA s2WithinGroups Psy 320 - Cal State Northridge
Logic • MSBetweenGroups /MSWithinGroups • Ratio approximately 1 if null true • Ratio significantly larger than 1 if null false • “approximately 1” can actually be as high as 2 or 3, but not much higher Psy 320 - Cal State Northridge
“So, why is it called analysis of variance anyway?” • Aren’t we interested in mean differences? • Variance revisited • Basic variance formula Psy 320 - Cal State Northridge
“Why is it called analysis of variance anyway?” • What if data comes from groups? • We can have different sums of squares Psy 320 - Cal State Northridge
Logic of ANOVA Psy 320 - Cal State Northridge
calculations Psy 320 - Cal State Northridge
Sums of Squares • The total variability can be partitioned into between groups variability and within groups variability. Psy 320 - Cal State Northridge
Degrees of Freedom (df ) • Number of “observations” free to vary • dfT = N - 1 • Variability of N observations • dfBG = g - 1 • Variability of g means • dfWG = g (n - 1) or N - g • n observations in each group = n - 1 df times g groups • dfT = dfBG + dfWG Psy 320 - Cal State Northridge
Mean Square (i.e. Variance) Psy 320 - Cal State Northridge
F-test • MSWG contains random sampling variation among the participants • MSBG also contains random sampling variation but it can also contain systematic (real) variation between the groups (either naturally occurring or manipulated) Psy 320 - Cal State Northridge
F-test • And if no “real” difference exists between groups Psy 320 - Cal State Northridge
F-test • The F-test is a ratio of the MSBG/MSWG and if the group differences are just random the ratio will equal 1 (e.g. random/random) Psy 320 - Cal State Northridge
F-test • If there are real differences between the groups the difference will be larger than 1 and we can calculate the probability and hypothesis test Psy 320 - Cal State Northridge
F distribution • There is a separate F distribution for every df like t but we need both dfbg and dfwg to calculate the FCV from the F table D.3 for alpha = .05 and D.4 for alpha = .01 Psy 320 - Cal State Northridge
1-way between groups Anova example Psy 320 - Cal State Northridge
Example • A researcher is interested in knowing which brand of baby food babies prefer: Beechnut, Del Monte or Gerber. • He randomly selects 15 babies and assigns each to try strained peas from one of the three brands • Liking is measured by the number of spoonfuls the baby takes before getting “upset” (e.g. crying, screaming, throwing the food, etc.) Psy 320 - Cal State Northridge
Hypothesis Testing • Ho: Beechnut = Del Monte = Gerber • At least 2 s are different • = .05 • More than 2 groups ANOVA F • For Fcv you need both dfBG = 3 – 1 = 2 and dfWG = g (n - 1) = 3(5 – 1) = 12 Table D.3 Fcv(2,12) = 3.89, if Fo > 3.89 reject the null hypothesis Psy 320 - Cal State Northridge
Step 6 – Calculate F-test • Start with Sum of Squares (SS) • We need: • SST • SSBG • SSWG • Then, use the SS and df to compute mean squares and F Psy 320 - Cal State Northridge
Step 6 – Calculate F-test Psy 320 - Cal State Northridge
ANOVA summary table and Step 7 • Remember • MS = SS/df • F = MSBG/MSWG • Step 7 – Since ______ > 3.89, reject the null hypothesis Psy 320 - Cal State Northridge
Conclusions • The F for groups is significant. • We would obtain an F of this size, when H0 true, less than 5% of the time. • The difference in group means cannot be explained by random error. • The baby food brands were rated differently by the sample of babies. Psy 320 - Cal State Northridge
Alternative computational approach Psy 320 - Cal State Northridge
Alternative Analysis – computational approach to SS • Equations • Under each part of the equations, you divide by the number of scores it took to get the number in the numerator Psy 320 - Cal State Northridge
Computational Approach Example Note: You get the same SS using this method
Unequal Sample Sizes • With one-way, no particular problem • Multiply mean deviations by appropriate ni as you go • The problem is more complex with more complex designs, as shown in next chapter. • Equal samples only simplify the equation because when n1= n2 =… = ng
Multiple comparisons Psy 320 - Cal State Northridge
Multiple Comparisons • Significant F only shows that not all groups are equal • We want to know what groups are different. • Such procedures are designed to control familywise error rate. • Familywise error rate defined • Contrast with per comparison error rate Psy 320 - Cal State Northridge
More on Error Rates • Most tests reduce significance level (a) for each t test. • The more tests we run the more likely we are to make Type I error. • Good reason to hold down number of tests Psy 320 - Cal State Northridge
TukeyHonestly Significant Difference • The honestly significant difference (HSD) controls for all possible pairwise comparisons • The Critical Difference (CD) computed using the HSD approach Psy 320 - Cal State Northridge
TukeyHonestly Significant Difference • where q is the studentized range statistic (table), MSerror is from the ANOVA and nA is equal n for both groups • for the unequal n case Psy 320 - Cal State Northridge
Tukey • Comparing Beechnut and Gerber • To compute the CD value we need to first find the value for q • q depends on alpha, the total number of groups and the DF for error. • We have 3 total groups, alpha = .05 and the DF for error is 12 • q = 3.77 Psy 320 - Cal State Northridge
Tukey • With a q of 3.77 just plug it in to the formula • This give us the minimum mean difference • The difference between gerber and beechnut is 3.8, the difference is significant Psy 320 - Cal State Northridge
Fisher’s LSD Procedure • Requires significant overall F, or no tests • Run standard t tests between pairs of groups. • Often we replace s2pooled with MSerror from overall analysis • It is really just a pooled error term, but with more degrees of freedom (pooled across all treatment groups) Psy 320 - Cal State Northridge
Fisher’s LSD Procedure • Comparing Beechnut and Gerber • tcv(5+5-2=8) = .05 = 1.860 • Since 3.55 > 1.860, the 2 groups are significantly different. Psy 320 - Cal State Northridge
Bonferroni t Test • Run t tests between pairs of groups, as usual • Hold down number of t tests • Reject if t exceeds critical value in Bonferroni table • Works by using a more strict value of a for each comparison Psy 320 - Cal State Northridge
Bonferroni t • Critical value of a for each test set at .05/c, where c = number of tests run • Assuming familywise a = .05 • e. g. with 3 tests, each t must be significant at .05/3 = .0167 level. • With computer printout, just make sure calculated probability < .05/c Psy 320 - Cal State Northridge
Assumptions for Analysis of Variance • Assume: • Observations normally distributed within each population • Population variances are equal • Homogeneity of variance or homoscedasticity • Observations are independent Psy 320 - Cal State Northridge
assumptions Psy 320 - Cal State Northridge
Assumptions • Analysis of variance is generally robust to first two • A robust test is one that is not greatly affected by violations of assumptions. Psy 320 - Cal State Northridge
Effect size Psy 320 - Cal State Northridge
Magnitude of Effect • Eta squared (h2) • Easy to calculate • Somewhat biased on the high side • Formula • Percent of variation in the data that can be attributed to treatment differences Psy 320 - Cal State Northridge
Magnitude of Effect • Omega squared (w2) • Much less biased than h2 • Not as intuitive • We adjust both numerator and denominator with MSerror • Formula Psy 320 - Cal State Northridge