Download
1 / 42
420 likes | 629 Vues
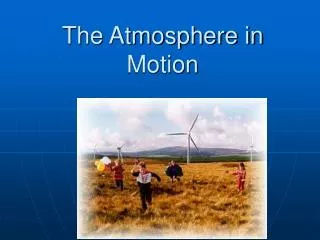
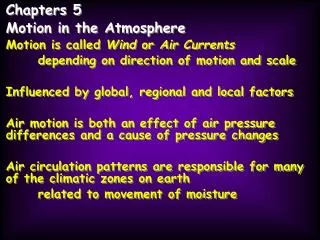
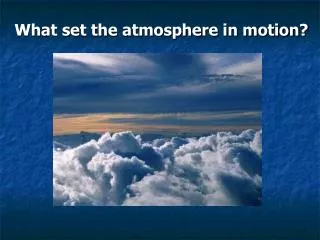
The Atmosphere in Motion. Chapter 19. Air Pressure & Wind section 1. Wind: Horizontal movement of air Helps moderate surface temperatures Distributes moisture “cleanses” the atmosphere Several forces affect direction of movement Caused by differences in air pressure.

E N D
The Atmosphere in Motion Chapter 19
Air Pressure & Windsection 1 • Wind: • Horizontal movement of air • Helps moderate surface temperatures • Distributes moisture • “cleanses” the atmosphere • Several forces affect direction of movement • Caused by differences in air pressure
What is Air Pressure? • Weight of the air pushing down on Earth’s surface • At sea level = 14.7 pounds per square inch (psi) • At sea level, the barometric pressure is 29.92 inches or 1013.2 millibars (mb). • As increase elevation, pressure decreases b/c less air above • Decreases ~50% every 5 km • Exerted in all directions
MercuryBarometer Weight of column of mercury is balanced by the pressure exerted on the dish of mercury from air above
Aneroid Barometer & Barograph • Without liquid • Partially evacuated metal chamber that compresses or expands based on outside pressure
Recording Air Pressure • Different units can be used to express air pressure • With a mercury barometer • Inches • Millimeters • Meteorologists use: • millibars
You can easily change from inches to millibars = 29.92 inches
Why Does Air Pressure Change? • Elevation • As altitude increases, pressure decreases • Temperature • As temperature increases, pressure decreases • Molecules move further apart as air is heated • So fewer air molecules than in same volume of cool air • Warm air lower pressure, cold air high pressure • Humidity • As humidity increases, pressure decreases • Water molecules have less mass than oxygen or nitrogen molecules
Why Does Air Pressure Change? • Changes in air pressure can aid in predicting the weather • A decrease in pressure often indicates approaching warmer, more humid, air along w/ rain or snow • Less dense air less pressure exerted • An increase in pressure often indicates approaching cooler, drier air & fair weather • More dense air more pressure exerted
Why Does Air Pressure Change? • Meteorologists analyze air pressure by plotting isobars on weather maps • Isobar: line that joins points of equalbarometric(air) pressure • A “closed” isobar forms a loop on a weather map • High-pressure area (“high”) • Air pressure steadily increases toward the center of a set of closed isobars ~Think of a hill • Low-pressure area (“low”) • Air pressure steadily decreases toward the center of a set of closed isobars ~Think of a valley
Pressure Gradient • Pressure Gradient = change in pressure change in distance • The closer the isobars, the steeper the gradient • Pressure changes quickly • Faster, stronger winds • The further the isobars, the more gentle the slope • Pressure changes slowly • Slower, weaker winds
What Makes the Wind Blow? Differences in pressure caused by unequal heating of Earth’s surface-Winds blow from areas of High to Low pressure H L WIND Falling air Rising air (cold, dry = more dense) (warm, moist = less dense) Fair weather stormy weather High Pressure Low Pressure
Measuring Surface Wind Direction & Speed • Wind vanes instrument to determine the direction of wind • Broad tail • Resists wind • “Points away” from where the wind is blowing from • Arrowhead • Points into the wind (where the wind is blowing from) • Winds are named for the direction from which they blow from • Examples • Blow from west (to east) = westerly (or west) wind • Nor’easter = winds from the northeast
Measuring Surface Wind Direction & Speed • Anemometer instrument used to measure wind speeds 10 meters above ground • Effects on water, smoke, trees, & other objects can also be used as estimates of wind speed.
Factors Affecting Windssection 2 • The Coriolis Effect: the tendency of an object (wind, ocean current, plane, etc.) moving freely over the earth’s surface to curve away from its path of travel • Due to Earth’s rotation • Northern Hemisphere deflect to right (from perspective of object) • Blow clockwise out of areas of high pressure • Blow counterclockwise into areas of low pressure • *****Diagrams • Southern Hemisphere deflect to left (from perspective of object) • Does not depend on object’s direction of movement • Only noticeable on large scale (winds, planes, ocean currents) • Greatest near poles, least near equator • Increases if speed of object increases
Coriolis Effect Animation Coriolis Effect & Wind Direction Visualiziation
Friction • Friction between the air & ground slows winds • Changes the impact of the Coriolis effect on surface winds • More friction less “deflection”/curving • Ex. rough land • Less friction more “deflection”/curving • Ex. smooth land or water • Winds at higher altitudes less friction stronger Coriolis effect
Jet Stream Video Internet Investigation: How Does the Jet Stream Change Through the Year? Friction • Jet stream: Band of very fast winds (120-240 km/hr) near the top of the troposphere (hardly affected by friction) • Typically 1000s of km long, 100s of km wide, & about 1 km from top to bottom • Polar-front jet stream: cool polar air joins w/ warmer air to the south • Generally flows west to east • Great effect on weather in the U. S. • Energy for storms, directs storms’ paths • Can reach to central FL in winter, generally over Canada and northern U.S. in summer • Speed depends on pressure gradient in upper troposphere (depends on surface temps) • Fastest in winter • Tropical-easterly jet stream: warm air in tropics of N. Hemisphere • Weaker than polar-front jet stream
Global Wind Patterns sec 3 • Affected by: • ***Unequal heating of Earth by sunlight (temp diff btw equator & poles) • ***Earth's rotation (spin) (& Coriolis effect) • Location of continents • Time of year • Local topography (landforms)
Global Wind Patterns • What would happen if Earth did not rotate & there was no Coriolis effect? • The unequal heating: • makes the tropical equatorial regions warmer than the polar regions. • lower pressure at the (warmer) equator • Air rises & moves toward poles • higher pressure at the (cold) poles • Polar air moves toward equator ~heats, rises, & continues cycle • Would result in one large circulation cell in each hemisphere
Effects of Earth’s Rotation • B/c Earth rotates: • Coriolis effect prevents air from flowing straight from equator to poles • Air flowing northward from equator is deflected to right • Air flowing southward from equator is deflected to left • Air cools & sinks long before reaches polar regions • Air circulation is better represented w/ 3-cells in each hemisphere • Idealized, not 100% accurate, but helpful in understanding global wind patterns
Effects of Earth’s Rotation • Three-Celled Circulation Model • 3 circulation cells in each hemisphere • 0 (equator)-30° • 30-60° • 60-90° (pole) • Direction of circulation changes from each cell to the next • Caused by alternating bands of high & low pressure at Earth’s surface • Polar front = boundary at 60° where air flows away from high pressure poles & collides w/ warmer air moving up from lower latitudes • As winds blow from high to low pressure, they are deflected by the Coriolis effect • To right in northern hemisphere • To left in southern hemisphere
Weaknesses of the Three-Celled Model • 3 main weaknesses • Gives a simplified view of circulation btw 30 & 60° • Referred to as middle latitudes or mid-latitudes • Most of the U. S. • Surfaces winds determined by locations of transient high- & low-pressure systems • Change often • Does not take into account the effects of the continents (heat & cool more rapidly than oceans) or seasons • Based on a simplified view of upper-level winds • Impression that generally travel N S • Primarily westerly (except near equator, Coriolis is weak)
Strength of the Three-Celled Model • Fairly accurate image of general surface winds & pressures outside the mid-latitudes • Gives a picture of wind patterns & pressure systems that is useful for climate studies • b/c involves averaging patterns over long periods
Description of Wind & Pressure Belts • Intertropical Convergence Zone (ITCZ) or doldrums: a low pressure belt at the equator where winds from both hemispheres come together • Little to no wind, hot & humid, rain is common • Tradewinds: blow from the NE (N. Hemi) & SE (S. Hemi) are found at about 30º N & S • Polar highs: high-pressure regions where cold air sinks at the poles • Polar easterlies: surface winds at poles that blow from east • Prevailing winds: winds that usually blow from same direction • Tradewinds • Polar easterlies • Prevailing westerlies which blow (SW in N. Hemi & NW in S. Hemi) in the mid-latitudes.
Polar Front Polar Front
Continental & Local Winds Sec 4 • Because of tilt of Earth, relative position of sun changes over year • Causes seasons • Temperature changes • Changes in global winds • Also affected by positions of continents • Highest temps in N. Hemi often N of equator • Sun causes air to heat, rise, & flow toward poles
Effects of Seasons & Continents • Summer • continents hotter than oceans • heats up (& cools down) faster than water b/c absorbs (& radiates) heat better • hot land heats air above it, becomes less dense, rises, causing low pressure • Oceans cooler than land • Heats up (& cools down) slower than land b/c does not absorb (& radiate) heat quickly • Cool water, air above cooler, more dense, higher pressure • Highs & lows determine direction of prevailing winds at various locations • Winter opposite from summer
Direction of winds change seasonally monsoons • Most dramatic in southern Asia • Winter cold, dry winds • Summer warm, moist winds & heavy rains
Local Winds • Extends 100 km or less • Caused mostly by differences in temperature • Examples: • Land & sea breezes • Mountain & valley breezes
Developing a Sea Breeze • Daytime • Land heats faster creating warm air above it. • decreases the pressure (& density) • air rises. • low pressure develops over land • Water heats slower, so it has cooler air above it. • Increases pressure (& density) • Air sinks • High pressure develops over water causing a difference in pressure. • Wind blows from high (sea) to low (land)
Developing a Land Breeze • Nighttime • Water stays warm longer creating warm air above it. • decreases the pressure (& density) • air rises. • low pressure develops over water • Land cools faster, so it has cooler air above it. • Increases pressure (& density) • Air sinks • High pressure develops over land causing a difference in pressure. • Wind blows from high (land) to low (sea)