Download
1 / 12
120 likes | 305 Vues
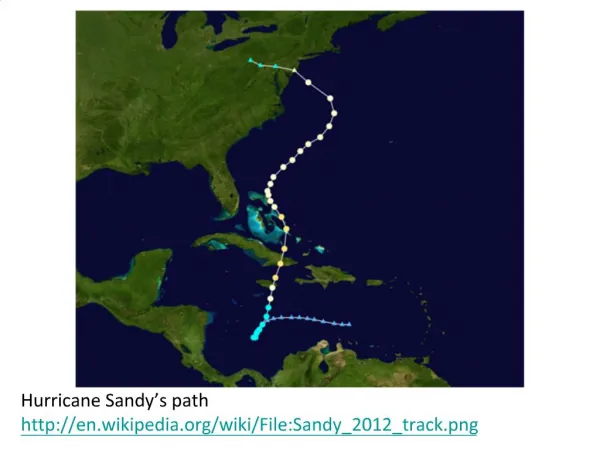
GeoSupport for Hurricane Sandy. “The Importance of NOAA Satellites” Panel NOAA Satellite Conference 2013. 12 April, 2013. Chris Vaughan Geospatial Information Officer DHS/FEMA. Whole Community approach to geospatial operations FEMA’s Modeling Task Force On-call, distributed analysis

E N D
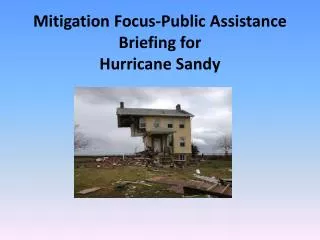
GeoSupport for Hurricane Sandy “The Importance of NOAA Satellites” Panel NOAA Satellite Conference 2013 12 April, 2013 Chris Vaughan Geospatial Information Officer DHS/FEMA
Whole Community approach to geospatial operations FEMA’s Modeling Task Force On-call, distributed analysis Real-time analysis to affect decisions Civil Air Patrol/NOAA collected 157,000+ images Over 147,000 individual structural assessments Expedited rental assistance Supported multiple interagency programs Ability to Innovate Outcome Based Results
Hurricane Sandy MOTF Timeline NRCC Activation, USGS MA’s HLT Deployment (Oct 23), Hurricane Sandy County Risk Matrix (QPF, Wind loss, CFLA, SLOSH models), MOTF portal Hybrid hindcast SLOSH, preliminary HWM observations (±150), expedited rental assistance, portal updates High resolution (3 ftLiDAR) observed inundation NYC OEM, Nor’easter surge modeling Field verified inundation (±1,000 observations), high resolution, LiDAR-based, major portal, expedited assistance, NFIP updates Field verified inundation (±300 observations), medium resolution (10 meter), portal, expedited assistance, NFIP updates Landfall Migration to impact analysis, Hindcast SLOSH, portal updates
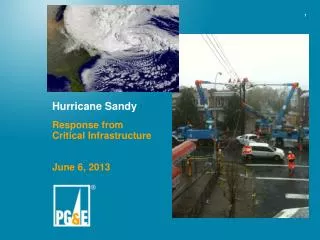
Tasked by three FEMA regions Airborne imagery, light air transportation, shelter management, and other 250+ members from 21 Wings/states 73 aircraft--1,407 flight hours--696 sorties Provided 158,012 geo-tagged images CAP liaison at NRCC as well as at state EOCs CAP Response Highlights
Leveraging Civil Air Patrol • Provides Rapid Imagery Collection and Cost-Savings Support During Sandy Response Set New Records… Breezy Point, Queens, NY # Photos / Day Photo Credit: Civil Air Patrol (New York Wing) Seaside Heights, NJ >150k Images Collected Sandy’s Landfall Photo Credit: U.S. Air Force (Balik) Photo Credit: Civil Air Patrol (New Jersey Wing)
Geospatial Damage Assessments Applications Assessment Source Housing Task Force Building Inspection Response Substantial Damage Estimation Debris Estimation Affected Affected Inundation Model to Observations Imagery IA Inspection (FVL) Minor Major Destroyed
How are the GDAs done? Part 1: The Web
Innovation Check Your Home • Built within a few hours overnight • Utilized CAP and NOAA imagery • Innovation on CAP imagery upload procedures allowed images to be added within minutes or hours not days • First time this data has been easily accessibly to the public • Over 16,000 visits the first day
Innovation External partners and crowd sourcing • MapMill provided over 6,000 volunteers • USNG 1k grid output from assessments • Partnered with Google Crisis Map, over 15 million unique visits