Mastering Multiple Regression Models: Analysis Strategies & Model Selection
Learn the fundamentals of multiple regression, from estimating coefficients to testing hypotheses, in the context of analyzing a unique data set with various independent variables and three dependent variables. Explore strategies such as stepwise regression for model refinement and interpretation of regression coefficient significance.

Mastering Multiple Regression Models: Analysis Strategies & Model Selection
E N D
Presentation Transcript
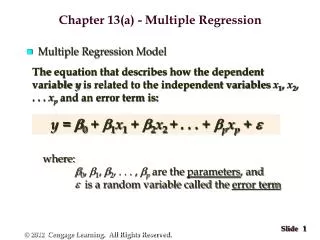
Chapter 22: Building Multiple Regression Models • Generalization of univariate linear regression models. • One unit of data with a value of dependent variable and p independent variables.
Multiple Regression Model • Yi is value of dependent variable for i-th unit. • The values xi1, xi2, …, xip are values of the independent variables. • Zi is an unobservable error:
Objectives • Estimate the regression coefficients β0, β1, …, βp. • Estimate σ (crucial for tests). • Test whether the regression coefficients β1, …, βp are all simultaneously zero (note that the intercept was left out). • Test whether some of the regression coefficients βq, …, βp are zero.
Assumptions for Multiple Regression • Regression function is linear. • Error terms are independent. • Constant error variance. • Distribution of errors is normal.
Context of your second project • Artificial data set, available on web site. • Each set is individual. • If you analyze the wrong data set, no credit! • Three dependent variables. • Three separate sections of your report! • Six independent variables. • 500 data points with replicated observations.
Check Scatterplots • Use scatterplot matrix to get a brief summary look. • Graphs, scatterplot, matrix. • If Y vs xi is flat and patternless, then your interpretation is that the regression coefficient of xi is xero. • Two of the dependent variables are random samples.
Strategy 1 • Enter all six independent variables (columns three through eight). • Statistics, regression, linear. • Examine R2 (easier to use sig of F statistic). • If R2 large (sig small), then that variable is not a random sample.
Analysis of variance table • Three rows: regression, residual, and total. • Five columns • degrees of freedom • sum of squares • mean square • F • sig
Table of regression coefficients • Contains the OLS estimates. • The line (constant) refers to β0, the intercept. • There is a line for each variable in the model that refers to βq, the partial regression coefficient (slope) of the q-th independent variable.
Table of regression coefficients • Five columns of numbers • Two are labeled “unstandardized coefficients” • B column contains the OLS estimates. • Std. Error contains the estimated standard deviation.
Table of regression coefficients • One is the standardized coefficient. • Scale free coefficient often used in social science studies for comparison across studies. • There is a column for t. • As usual, t=(B-0)/(se B). • There is a column for sig. • Interpret as a p-value.
Interpretation • There appears to be an association between an independent variable and the dependent variable if the observed significance level is small for that coefficient. • Specify which variable has associations and the significant independent variables.
Refinement of Model • Rerun regression using only those variables that appear to be significant. • Usually, the database of a study has many variables that have no association with the dependent variable. • Most clients prefer that these variables not be used. • There are some technical problems with this approach that are widely ignored.
Partial correlation coefficient • Correlation between Y and X2, “controlling for” X1 (holding the variable “constant”) • given by the equation:
Strategy 2: Stepwise Regression • Let the computer do the work. • In regression box, specify stepwise. • The computer will see whether additional variables can be added or added variables deleted. • There are three basic strategies: forward selection, backward selection, and stepwise.
Stepwise regression strategy • Find independent variable with largest correlation with Y. • Check whether that is significant. • If no, stop. • If yes, check second variable.
Stepwise regression strategy • Find independent variable with highest partial correlation, controlling for first. • If not significant, stop. • If significant, check for a third variable. • Find independent variable with highest partial controlling for first two.
Stepwise regression strategy • Check whether its addition is significant. • If no, stop. • If yes, see whether the first or second step variable still adds. • Continuing interating until there are no variables that can be added or deleted.
Using Stepwise Regression • Examine final model selected. • Note which variables are included. • Examine information for excluded variables. • Check whether there is any possibility that one of the variables left out might matter.
Checking the Model • Residual plots. • Diagnostics. • Lack of Fit test. • More next class and after the exam.
Univariate Linear Regression Problem • Model: Y=b0+b1X+e • Test: H0: β1=0. • Alternative: H1: β1>0. • The distribution of Y is normal under both null and alternative. • Under null, var(Y)=σ02. • Under alternative, β1>0, and var(Y)=σ12.
Step 1: Choose the test statistic and specify its null distribution • Use conditions of the null to find:
Bringing sample size into regression design • The sample size n is hidden in the regression results. That is, let:
Step 2: Define the critical value • For the univariate linear regression test:
Step 3: Define the Rejection Rule • Each test is a right sided test, and so the rule is to reject when the test statistic is greater than the critical value.
Step 4: Specify the Distribution of Test Statistic under Alternative • Use conditions of the null to find:
Step 5: Define a Type II Error • For the univariate linear regression test:
Step 6: Find β • For a univariate linear regression test:
Step 7: Phrase requirement on β • That is, choose n so that (after algebraic clearing out):
Univariate Linear Regression • Note that the σ0 factor is changed to σ0/σX. • There is a similar adjustment for the alternative standard deviation.