Goals, Values and Performance
Explore strategies to maximize firm value through shareholder-centric approaches, profit maximization, and value creation. Learn how to evaluate performance using financial measures and establish goals for sustainable growth.

Goals, Values and Performance
E N D
Presentation Transcript
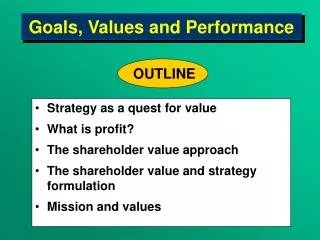
Goals, Values and Performance OUTLINE • Strategy as a quest for value • What is profit? • The shareholder value approach • The shareholder value and strategy formulation • Mission and values
Strategy as a Quest for Profit • The stakeholder approach: The firm is a coalition of interest groups—it seeks to balance their different objectives. • The shareholder approach: The firm exists to maximize the wealth of its owners. • Why is profit maximization a reasonable goal? (1) Boards of directors legally obliged to pursue shareholder interests. (2) To replace assets, firm must earn return on capital > cost of capital (difficult when competition intense). (3) To avoid acquisition, firm must achieve stock-market value > break-up value.
What is Profit? • Profit maximization an ambiguous goal • Total profit vs. Rate of profit • Over what time period? • Accounting profit versus Economic profit • Economic Value Added (EVA) as a measure of economic profit: — Post-tax operating profit lesscost of capital • From profit maximization to value maximization —Net present value of firm = Discounted future profits over the life of the firm
How U.S. Companies Perform Under Different Profitability Measures, 1998 Net Inc. ROS ROE EVA Market Return to Value Added Shareholders ($m) (%) (%) ($m) ($m) (%) General Motors 2,956 1.8 19.7 -5,525 -17,943 21.4 General Electric 6,573 9.4 22.2 4,370 285,320 45.3 Exxon 6,370 6.3 14.6 -2,262 114,774 22.4 Philip Morris 5,450 10.3 39.0 5,180 98,657 64.8 IBM 6,328 7.7 32.6 2,541 -5,878 77.5 Coca-Cola 3,533 18.8 42.0 2,194 157,356 1.3 Wal-Mart 4,430 3.2 21.0 1,159 159,444 107.7 Procter & Gamble 3,780 10.2 12.2 61,661 102,379 15.9 Microsoft 4,490 31.0 27.0 3,776 328,25737.5 Hewlett-Packard 2,945 6.3 17.4 -593 45,464 10.7
Value Maximization Maximizing the value of the firm: Max. net present value of free cash flows : max. V = Ct (1 + re)t t Where: V market value of the firm. Ct free cash flow in time t re+d weighted average cost of capital
Applying Shareholder Value Maximization to Strategy Choice • Identify strategy alternatives • Estimate cash flows associated with cash strategy • Estimate cost of capital for each strategy • Select the strategy which generates the highest NPV
Valuing Companies and Business Units If net case flow growing at constant rate (g) V = C1 ( r - g ) With varying cash flows which can be forecasted for 4 years: V = C0 + C1 + C2 + C3 + VH (1 + r ) (1 + r )2 (1 + r )3 (1 + r )3 where: VH is the horizon value of the firm after 4 years
Problems of DCF Approaches to Strategy Approach • Net Present Value of the Firm depends on option values as well as discounted cash flow expectations • Estimating cash flows beyond 2-3 year horizon is hazardous---especially in dynamic markets HENCE: Some simple guidelines for maximizing the value of the firm— • On existing assets-- maximize after-tax rate of return • On new investment-- seek after-tax rate of return > cost of capital
The six levers of financial and real options Financial options Real options Comments Present value of returns to the investment The greater the NPV, the higher the option value Stock price = Exercise price The higher the cost, the lower the option value = Investment cost OPTION VALUE Uncertainty Uncertainty Higher volatility increases option values = Time = opportunity to learnabout outcomes Time to expiry Duration of option = Loss of cash flow to fully -committed competitors lowers option value Dividends Value lost over duration of option = Risk-free Interest rate Risk-free interest rate Higher interest rate increases option value by increasing value of deferring investment =
Disaggregating Return on Capital Employed COGS/Sales Return on Sales Depreciation/ Sales SGA expense/ Sales ROCE Fixed Asset Turnover Sales/PPE Inventory Turnover Sales/Inventories Sales/Capital Employed Creditor Turnover Sales/Acct Turnover of other items of working capital
Linking Value Drivers to Performance Targets Order Size Customer Mix Sales Targets Sales/Account Customer Churn Rate Margin cogs/ sales Deficit Rates Cost per Delivery Development Cost/Sales Maintenance cost Shareholder value creation ROCE New product development time Indirect/Direct Labor Inventory Turnover Customer Complaints Economic Profit Capital Turnover Downtime Capacity Utilization Accounts Payable Time Cash Turnover Accounts Receivable Time CEO Corporate/Divisional Functional Departments & Teams
Balanced Scorecard for Mobil N. American Marketing & Refining Strategic Objectives Strategic Measures F I N A N C I A L F1 Return on Capital Employed F2 Cash Flow F3 Profitability F4 Lowest Cost F5 Profitable Growth F6 Manage risk * ROCE * Cash Flow * Net Margin * Full cost per gallon delivered to customer * Volume growth rate Vs. industry * Risk index Financially Strong C O U M S E T R - C1 Continually delight the targeted consumer C2 Improve dealer/distributor profitability * Share of segment in key markets * Mystery shopper rating * Dealer/distributor margin on gasoline * Dealer/distributor survey Delight the Consumer Win-Win Relationship I N T E R N A L I1 Marketing 1. Innovative products and services 2. Dealer/distributor quality I2 Manufacturing 1. Lower manufacturing costs 2. Improve hardware and performance I3 Supply, Trading, Logistics 1. Reducing delivered cost 2. Trading organization 3. Inventory management I4 Improve health, safety, and environmental performance I5 Quality * Non-gasoline revenue and margin per square foot * Dealer/distributor acceptance rate of new programs * Dealer/distributor quality ratings * ROCE on refinery * Total expenses (per gallon) Vs. competition * Profitability index * Yield index Delivered cost per gallon .Vs. competitors * Trading margin * Inventory level compared to plan & to output rate * Number of incidents * Days away from work * Quality index Safe and Reliable Competitive Supplier Good Neighbor On Spec On time L E & A G R R N O I W N T G H L1 Organization Involvement L2 Core competencies and skills L3 Access to strategic information * Employee survey * Strategic competing (?) availability * Strategic information availability Motivated and Prepared
A Comprehensive Value Metrics Framework • Shareholder • Value • Measures: • Market value of the • firm • Market value added • (MVA) • Return to • shareholders • Intrinsic • Value • Measures: • Discounted cash • flows • Real option values • Financial • Indicators • Measures: • Return on Capital • Growth (of • revenues &operating • profits • Economic profit (EVA) • Value • Drivers • Sources: • Market share • Scale economies • Innovation • Brands
The Paradox of Value The companies that are most successful in creating long term shareholder value are typically those that: • Have a mission—They give precedence to goals other than profitability and shareholder return; • Have strong, consistent, ethical values. • Examples: • “Visionary” companies studied by Collins & Porras, • e.g. Merck, Wal-Mart, Procter & Gamble, Disney, HP • Boeing — Boeing’s focus pre-1996: “to build great planes” • with weak financial controls • — post-1996 focus: creating shareholder value • — after 2000, rapid decline in Boeing profitability
Values and Mission The role of (ethical) values : • Place constraints on the means by which the firm will pursue shareholder value max. • Increase the effectiveness with which the firm builds competitive advantage though reinforcing strategic intent and building internal consensus and commitment. The role of mission: • Foundation for strategy Statement of what the firm seeks to achieve and what it intends to become.