Download
1 / 19
190 likes | 311 Vues
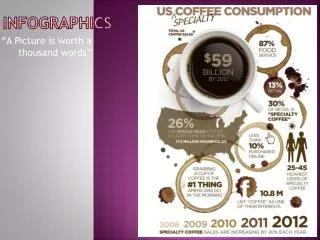
Infographics, graphs, and charts are essential in professional design, helping to convey information clearly and effectively. A well-organized chart can display data in a way that facilitates understanding, while a thoughtfully designed graph can inspire change and drive action. This project focuses on the importance of gathering relevant research, asking the right questions, and using effective design principles to create visually appealing and informative graphics. By emphasizing placement, color, text, and overall composition, you can enhance visual communication and express unique ideas.

E N D
Graphs and charts play a crucial role in professional designs and companies. • How can a well organized chart help display information so that information can be used? • How can a well designed graph inspire change? • The design, however, means nothing without important information…
Gathering research - Sketchbook • What interests you to the point in wanting to find quantitative information? • How will you gather the information for your chart or graph? • Who will you contact? Interview? What will you ask? • The purpose of this project is: • To successfully develop a meaningful question in which you will gather related information. • To successfully depict the gathered information in a graphic chart or graph.
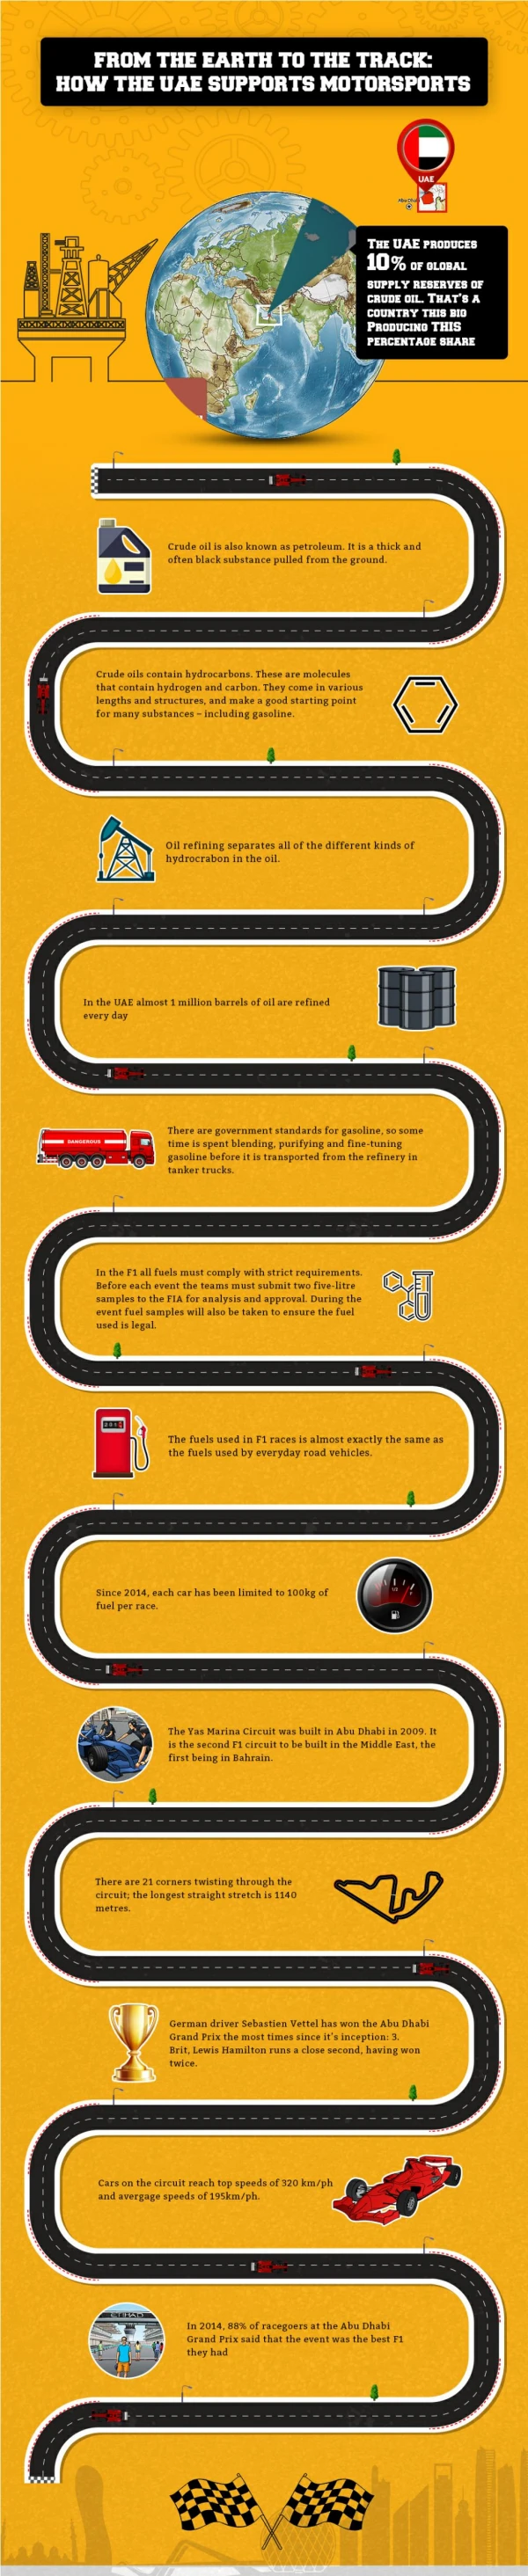
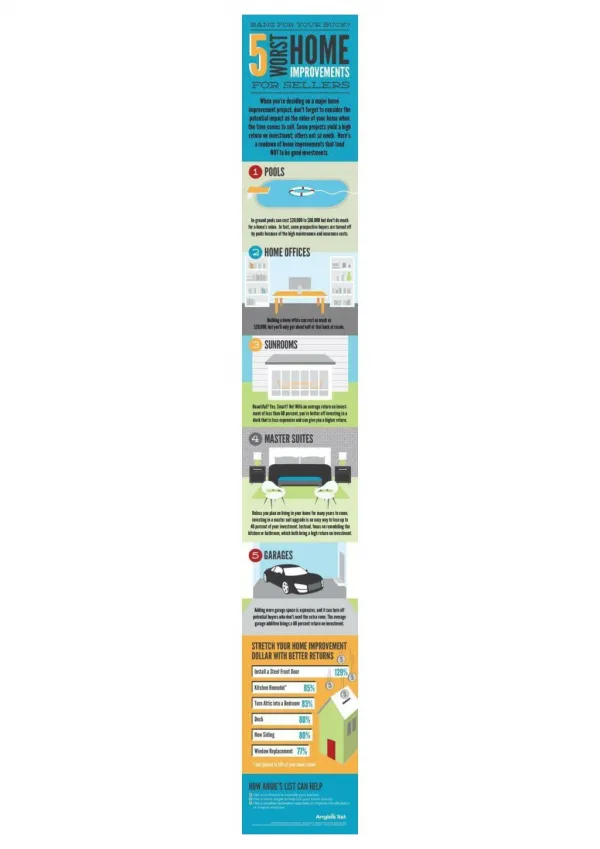
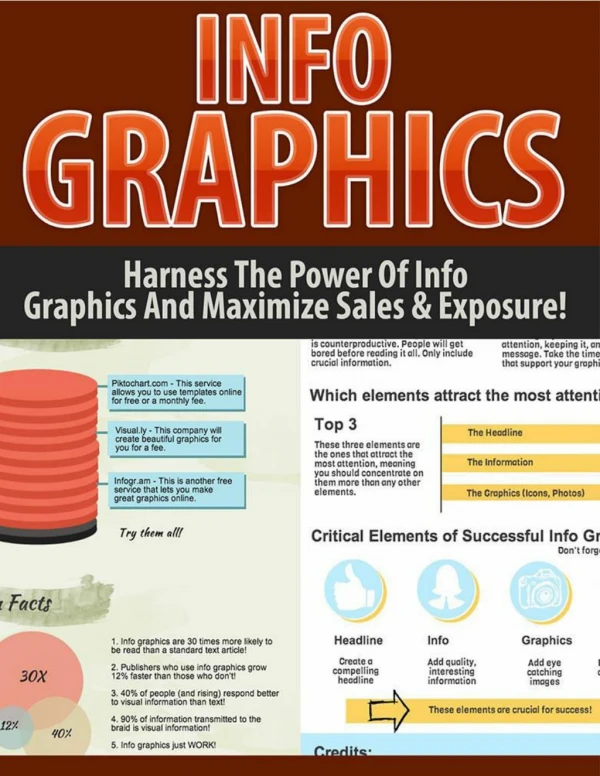
The Chart or Graph • Please be mindful of placement on the page • Please be mindful of color usage • Please be mindful of selected text • Please be mindful of overall composition • Please be mindful of repetition, shape, balance, line, rhythm, texture, etc. • Need visual inspiration? Infographics
What both I and the AP Portfolio Readers are looking for… • Excellence • Verve • Imagination • Inventiveness • Confidence • Student Voice • Risk-Taking