Measure Projection Analysis: Practicum
140 likes | 287 Vues
Measure Projection Analysis: Practicum. Nima Bigdely-Shamlo , Tim Mullen, Ozgur Yigit Balkan Swartz Center for Computational Neuroscience INC, UCSD, 2011. GUI Overview. Domain operations (similar to IC cluster operations). Measure type. Steps: Select a measure and ‘Project’.

Measure Projection Analysis: Practicum
E N D
Presentation Transcript
Measure Projection Analysis: Practicum NimaBigdely-Shamlo, Tim Mullen, OzgurYigit Balkan Swartz Center for Computational Neuroscience INC, UCSD, 2011
GUI Overview Domain operations (similar to IC cluster operations) Measure type Steps: Select a measure and ‘Project’. Visualize the result and select significance threshold (optional). Create Domains: cluster projections Analyze Domains: compare conditions, groups… similar to operations performed on IC clusters. Each commands runs the chain of pre-required commands.
Installation: unzip [USB drive content]/eeglab10_2_5_5a/ folder into your home directory . If you already have this version (but not from this USB), copy unzipped /eeglab10_2_5_5a/plugins/measure_projection/ folder from to your computer. • Run EEGLAB in Matlab from [home directory]/eeglab10_2_5_5a/. If this version was already running, type >> eeglab rebuild; • In EEGLAB, go to File->Memory and other options and make sure that the option indicated below is checked: Installation
Load study_rsvp.study from [USB driver]/Advanced_EEGLAB_Workshop/Session C - MPA/Data/rsvp_studyin EEGLAB. • Check if can you see Measure Projection under Study menu. Loading Sample Study
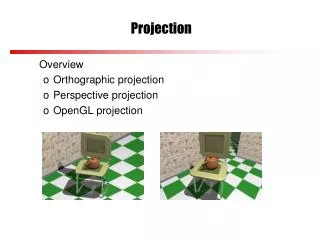
Go to Study->Measure Projection -> ERSP -> Project • Click Show colored by Measureunder ERSP menu (result A). • Click Create Domains under ERSP menu. Notice ‘Domains’ submenu become available, this will take some time to finish…(you may alternatively load study_rsvp_with_ersp_domains.studyto save time, although it can crash Matlab 2009a on 32 bit Windows) • Click Show colored by Domainunder ERSP menu (result B). GUI (A) (B)
if your Matlab crashed while loading study_rsvp_with_ersp_domains.studyor study_rsvp_with_domains.study , try loading study_rsvp_with_erp_domains.studywhich is considerably smaller. • You can now follow practicum steps for ERP, instead of ERSP. GUI
Click on ERSP->Domains -> Domain 2 -> Show Measure • Click on ERSP->Domains -> Domain 2 -> Show condition difference. GUI: Condition Differences
Click on ERSP->Domains -> Domain 2 -> Show high contributing scalp maps • Click on ERSP->Domains -> Domain 2 -> Show high contributing dipoles GUI: Domain Dipoles
Load study_rsvp_with_domains.studyin EEGLAB. • On Windows 32 bit with old Matlab (2009a), this operation may crash Matlab, instead you can try loading files named study_rsvp_with_[measure name: erp, ersp…]_domains.studyseparately. • All domain for different measures (ERP, ERSP, ITC..) are already created, choose different measures and run commands on their domains. GUI ERP Domain 3 ITC Domain 1
Select Measure Projection->Options • Change ERSP->Significance from 0.01 to 0.001 • Close the figure. • Select STUDY -> Measure Projection->ERSP-> Show colored by Measure Setting Options from GUI
1) Load ERSP data into MPT (creates a Matlab object): • >> erspInfo = pr.dipoleAndMeasureOfStudyErsp(STUDY, ALLEEG); • Type >> erspInfoto see what information is contained in the object. • 2) Create a head grid: • >> headGrid = pr.headGrid; • (you can run headGrid.plot; to see the grid) • 3) Project ERSP (using this head grid) and calculate significance of projections: • >> erspProjection= pr.meanProjection(erspInfo, erspInfo.getPairwiseCorrelationSimilarity, headGrid); • (all in one line, press Tab key to autocomplete) • 4) Visualize significant locations: • >> erspProjection.plotVolume(0.01); Scripting
5) To see the list of function of measure projection object erspInfotype: • >> methods(erspProjection) • 6) Visualize ERSP domain 4 (calculated before and saved in the STUDY.measureProjection): • >> domain4 = STUDY.measureProjection.ersp.projection.domain(4).plotVolume; • >> domain4.plotVolume; • >> domain4.plotMeasure; • 7) Create subject space with domain 4 as an ROI: • >> subjectSpace= pr.subjectSpace(erspInfo, headGrid, erspProjection.projectionParameter, domain4.membershipCube); • 8) Plot subject space in 2D: • >> subjectSpace.plot; Scripting
MPT uses Matlab object classes, so it is easy to find functions that act on each object. (place a dot after the name of the object and press the Tab key • Variable and function names are descriptive. • MPT objects have minimal interdependency (almost all related information is encapsulated in the properties of each object to simply scripting). • You can extend the toolbox by deriving new classes from current object. Scripting
New versions of MPT can be downloaded directly from our repository:https://bitbucket.org/bigdelys/measure-projection/get/default.zip • Please report bugs/feature request using our issue tracking system (no login necessary): • https://bitbucket.org/bigdelys/measure-projection/issues?status=new&status=open • A Wiki is under construction and located at: • http://sccn.ucsd.edu/wiki/MPT • These links are available under Measure Projection->About menu. New Versions