Measure Projection Analysis
260 likes | 397 Vues
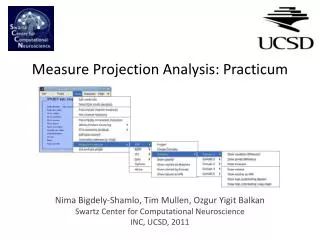
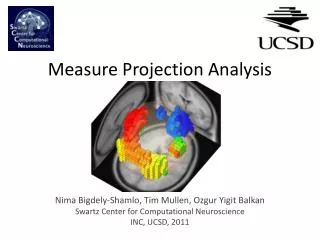
Measure Projection Analysis. Nima Bigdely-Shamlo , Tim Mullen, Ozgur Yigit Balkan Swartz Center for Computational Neuroscience INC, UCSD, 2011. Outline. Current EEGLAB Workflow STUDY IC Clustering Issues with IC Clustering Measure Projection method Practicum.

Measure Projection Analysis
E N D
Presentation Transcript
Measure Projection Analysis NimaBigdely-Shamlo, Tim Mullen, OzgurYigit Balkan Swartz Center for Computational Neuroscience INC, UCSD, 2011
Outline • Current EEGLAB Workflow • STUDY IC Clustering • Issues with IC Clustering • Measure Projection method • Practicum (please start copying the content of workshop USB driver to your computer)
Current EEGLAB Workflow Single Session Analysis Trying to produce ‘Nice clusters’ Study Analysis
Study IC Clustering • Assumes there are functionally equivalent ICs across most subjects. • Assumes these ICs have similarresponsesto experimental conditions across all measures (ERP, ERSP, ITC…) • Creates Non-Overlapping partitions:each IC belongs only to one cluster.
Study IC Clustering Sometime clusters are spatially separate AND have distinct responses. In other cases, they have similar responses or they overlap spatially.
Conceptual Problems with Study IC Clustering • Components may have similar responses for one measure (e.g. ERSP) but not for the other (e.g. ERP).
Conceptual Problems with Study IC Clustering Clustering boosts evidence by rejecting ICs that are in the same brain area but show different responses. This makes calculating significance values difficult. How can we make sure that we are not ‘imagining clusters’?
Practical problems with current methods of Study IC Clustering Large parameter space issue: many different clustering solutions can be produced by changing parameters and measure subsets. Which one should we choose? EEGLAB original clustering has ~12 parameters
Problems with multi-measure clustering What are the clusters according to location?
Problems with multi-measure clustering What are the clusters according to circle Size ?
Problems with multi-measure clustering What are the clusters according to both circle location and size? The answer highly depends on how much weight is given to each factor (measure).
Problems with multi-measure clustering Alternatively we could find local neighborhoods (on a grid) with significant (unlikely by chance) similarity in circle Size.
Problems with multi-measure clustering We can define a local-average circle size for each grid location and then cluster these values to form Domains. Domain 2 Domain 3 Domain 1
Measure Projection • Instead of clustering, we assign to each location in the brain a unique EEG response. • The response at each location is calculated as the weighted sum of IC responses in its neighborhood. • Weights are assigned by passing the distance between the location and IC dipole through a Gaussian function. • The std. of this function represent expected error in dipole localization and inter-subject variability.
Measure Projection IC Gaussian neighborhood (12 mm std.) Local Mean max IC IC min
Measure Projection • Each EEG measure (ERP, ERSP..) is projected separately. • Only has one (1) parameter: std. of Gaussian (which has a biological meaning). • Bootstrap (permutation) statistics can be easily and quickly performed for each point in the brain. • A regular grid is placed in the brain to investigate every area (with ~8 mm spacing).
Measure Projection • Not all projected values are significant. • Some are weighted means of ICs with very dissimilar responses. • Only projected values in neighborhoods with convergent responses are significant. • Convergence can be expressed as the mean of pair-wise similarities in a spatial neighborhood. • The significance of convergence at each location can be calculated with bootstrapping (permutation).
Measure Projection For a neighborhood with a ‘fixed’ boundary, for each IC pair we can define a membership function: Where M(IC) is one (1) if IC is in the neighborhood and zero (0) otherwise. Convergence can then be defined: Where M is the neighborhood membership matrix and S is the pairwise similarity matrix. This is basically the mean of pairwise IC similarities around a location in the brain.
Measure Projection Now we can extend this concept of convergence to neighborhoods with ‘soft’ Gaussian boundaries, for each IC pair we modify the membership function: Where (d is distance from IC equiv. dipole to neighborhood center). Convergence can now be defined as: IC1 d1 d2 IC2 Where S is the pair-wise similarity matrix. This is basically the weighted mean of IC similarities around a location in the brain.
Measure Projection: RSVP Example To better visualize measure responses in areas with significant convergence, they can be summarized into different domains. The exact number of these domains depends on how similar their exemplars are allowed to be.Below you can see ERSP responses in an EEG experiment form three (3) domains. Domain 2 (P300 -like) Domain 3 Domain 1 Multi-dimensional scaling visualization of ERSP projections for convergent locations.
Measure Projection: RSVP Example • Rapid Serial Visual Presentation Experiment • 8 subjects • 15 Sessions • Visual target detection • 257 components with equiv. dipoles inside the brain 4.1 s 1 s Fixation screen Burst of 49 clips at 12 Hz Subject input Time Non-target Target Non-target
Measure Projection: RSVP Example Clusters Domains
Subject Space Measure or dipole density similarity between each two EEG subjects (or sessions) may be averaged over a region of interest (ROI) and visualize using multi-dimensional scaling. Dipole density Projected ERSP at ROIs Projected ERSP at all brain locations
Measure Projection: Summary • Enables us to compare subjects, groups and conditions at every brain location. • Enables us to calculate significance on every step. • Enables us to perform new types of analysis that we could not do with IC clusters (e.g. subject similarity space) • All types of analysis that can be done on IC clusters, can also be performed in Measure Projection framework.